Hi everyone
As a weather guy I’m working on creating 3D animation of various atmospheric fields
I’ve managed to create a 3D graph but now I’d like to add a 2d map world within the same graph so the viewer will get the reference on where we are located in the world
Hi @stavnahum,
Welcome to forum!! You can plot a map included in a plane, like this one:
[https://plot.ly/~empet/14375/] (https://plot.ly/~empet/14375/).
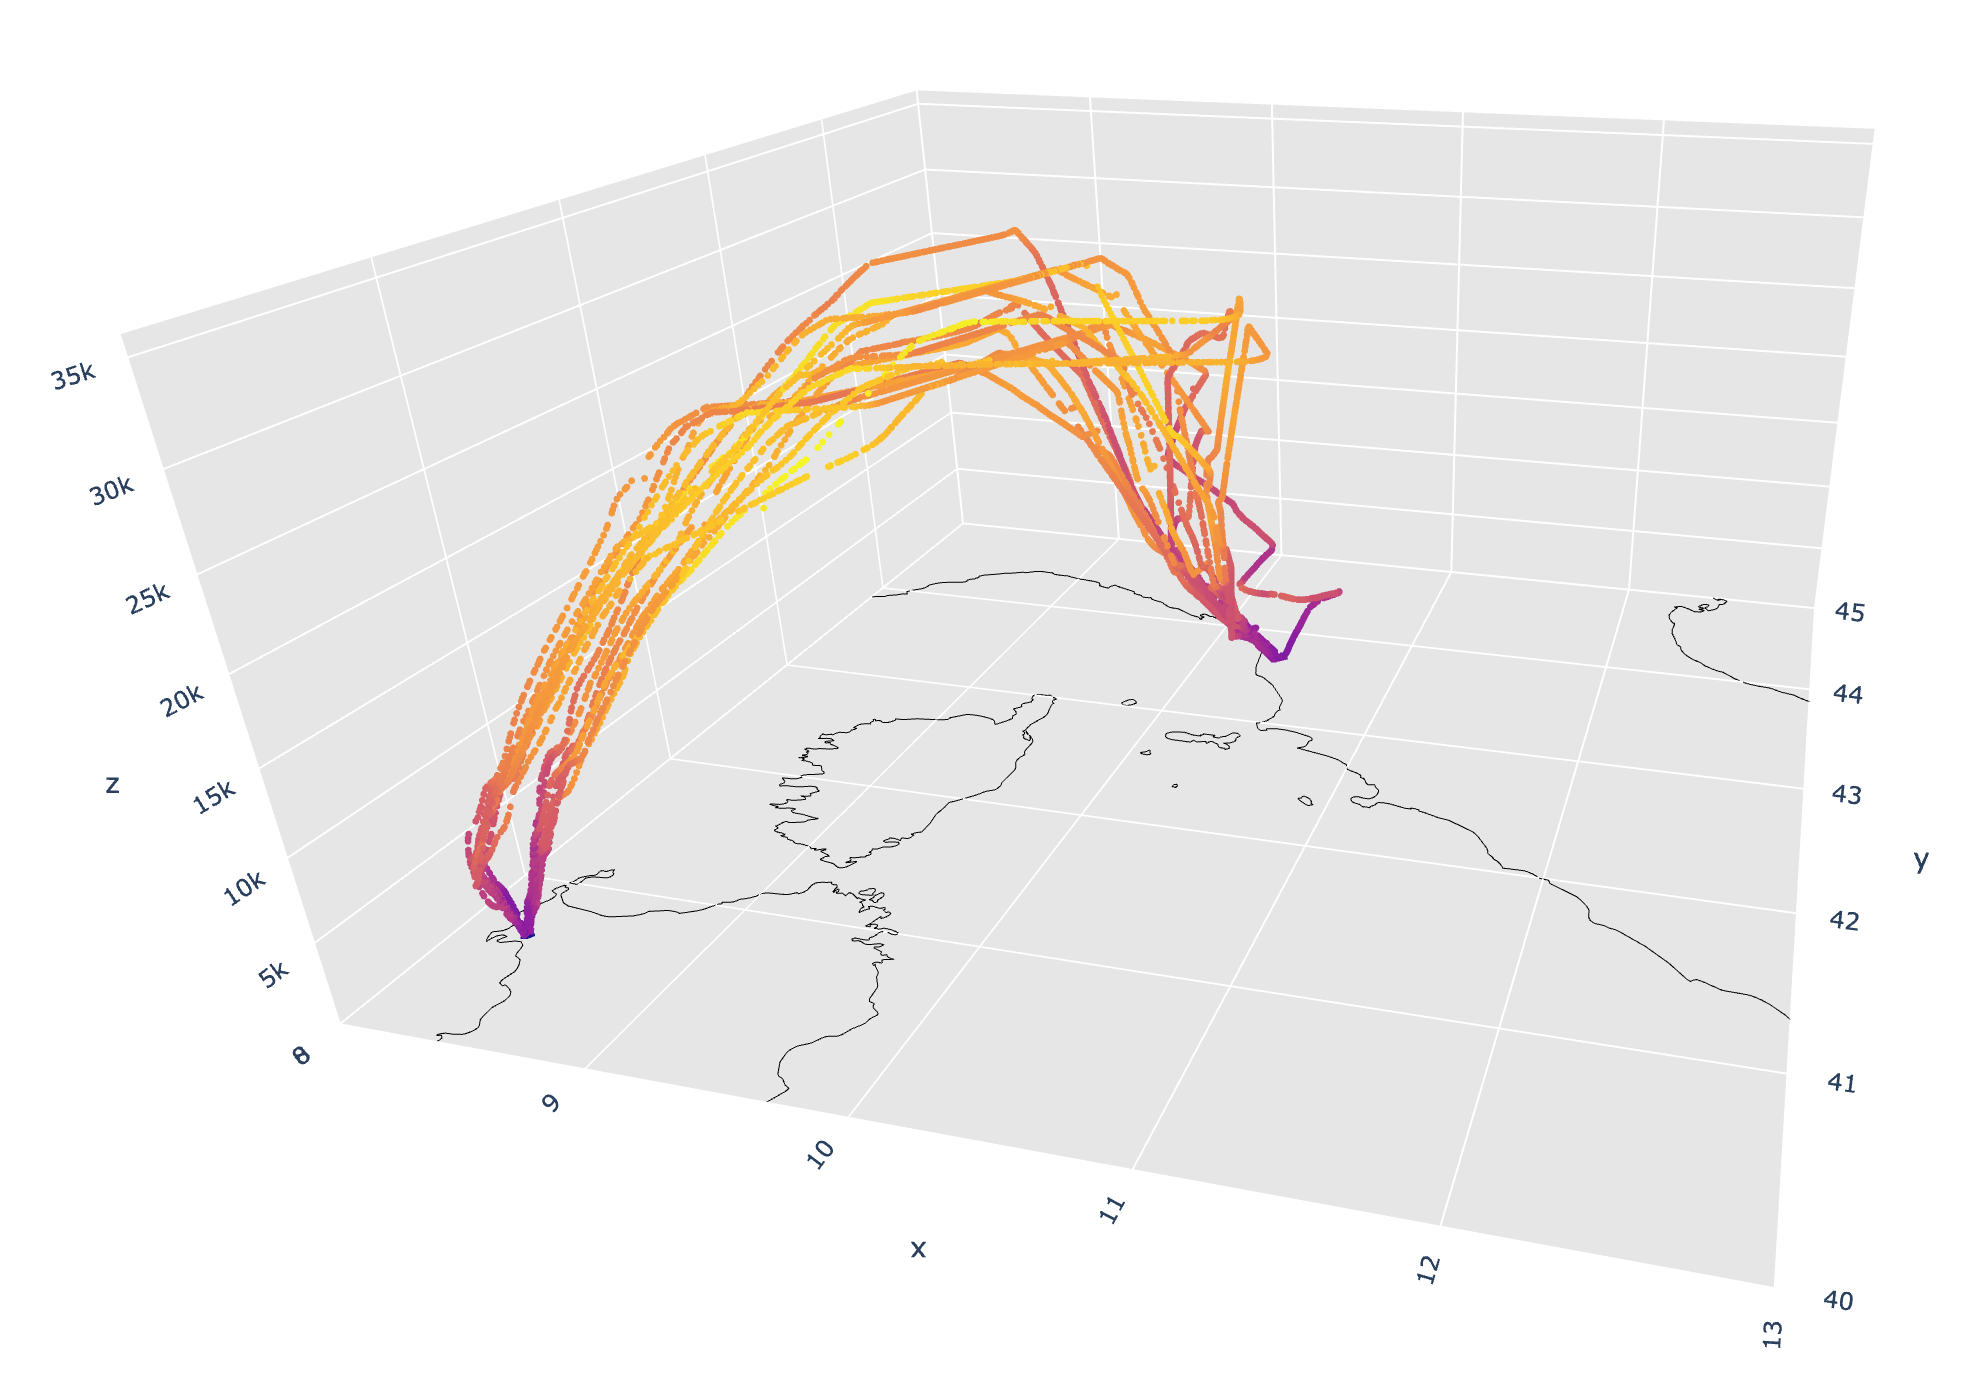
You have to read the geometry of a continent, country or region boundary from a geojson fiile or a shapefile, and plot it as a go.Scatter3d instance, mode ='lines'.
x, y are longitude, latitude and z the altitude (in feet).
I would like to add instead a proper map with rasters, similar to what is done in all the functions used in plotly express to make 2D scatter plots. Is it really hard to extend this to the 3D scatter plot?
This looks really sick! I’m working on a satellite constellation network project, and this would look absolutely amazing for my paper. Is it alright if I snag a copy of this code from you?