Is it possible to add a shape to a 3D plot?
I am trying to add a “floor” to my 3D plot. I tried using add_trace with a shape, but not having any luck getting the shape to show up. Should this work? or is there a better approach. Basically, I want to add a little color to the z plane, so its clear which way is up and down in my plot. thanks
Shapes can be inserted only in 2D plots.
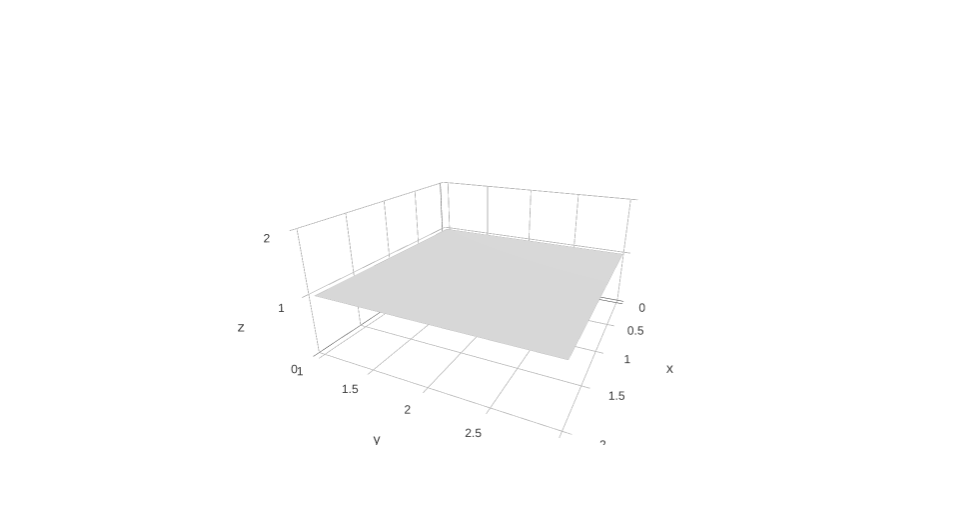
But you can plot a colored z-plane, defining it as a surface:
import  numpy as np
import plotly.plotly as py
x=np.linspace(0,2, 50)
y=np.linspace(1,3, 50)
x,y=np.meshgrid(x,y)
z_level=1.0#plot a z-plane at height 1
z=z_level*np.ones(x.shape)
single_color=[[0.0, 'rgb(200,200,200)'], [1.0, 'rgb(200,200,200)']]
z_plane=dict(type='surface', x=x, y=y, z=z,
                     colorscale=single_color, showscale=False)
fig=dict(data=[z_plane])
py.iplot(fig)
is this still impossible, or has this functionality been implemented in the past years?
My case is similar… but it’s not a square shape. Is there any solution for this existent? My question was made in stackoverflow
@NEGU93
I do not understand exactly your issue. What is wrong with your plot? The polygons are not filled in?!!
It seems that the polygon is not closed.
The first and last value in the coordinate lists should coincide.
I tried then to “close” the figures using:
a1.append(a1[0])
a0.append(a0[0])
However the result stays the same.
What is wrong:
The original code was this, I just wanted to fill the surfaces of the histograms drawn there with the command surfaceaxis=0 and even though a fill was done, it get’s out of the line contours.
Original image:

Intent of filling the histograms:

To fill in your region plotly.js triangulates it by Delaunay triangles https://en.wikipedia.org/wiki/Delaunay_triangulation.
But the Delaunay triangulation is a triangulation of the convexhull of the given points (in your case, the points of coordinates (x[i], a1[i], a0[i]) . What is displayed is their convex hull. You needed more points in each region to get the right triangulation.
Update: To avoid the drawback of the Delaunay triangulation, discussed above, I defined a function that triangulates each histogram bar, and now the histogram is an instance of go.Mesh3d:
import numpy as np
import pandas as pd
import plotly.graph_objects as go

def triangulate_histogtam(x, y, z):

    if len(x)  != len(y) != len(z) :
        raise ValueError("The  lists x, y, z, must have the same length")
    n = len(x)
    if n % 2 :
        raise ValueError("The length of lists x, y, z must be an even number")
    pts3d = np.vstack((x, y, z)).T
    pts3dp = np.array([[x[2*k+1], y[2*k+1], 0] for k in range(1, n//2-1)])
    pts3d = np.vstack((pts3d, pts3dp))
    #triangulate the histogram bars:
    tri = [[0,1,2], [0,2,n]]
    for k, i  in zip(list(range(n, n-3+n//2)), list(range(3, n-4, 2))):
        tri.extend([[k, i, i+1], [k, i+1, k+1]])
    tri.extend([[n-3+n//2, n-3, n-2], [n-3+n//2, n-2, n-1]])
    return pts3d, np.array(tri)

# data
np.random.seed(123)
df = pd.DataFrame(np.random.normal(50, 5, size=(300, 4)), columns=list('ABCD'))

# plotly setup
fig = go.Figure()

# data binning and traces
bins = 10

bar_color = ['#e763fa', '#ab63fa', '#636efa', '#00cc96']
for m, col in enumerate(df.columns):
    a0=np.histogram(df[col], bins=bins, density=False)[0].tolist()
    a0=np.repeat(a0,2).tolist()
    a0.insert(0,0)
    a0.pop()
    a0[-1]=0
    a1=np.histogram(df[col], bins=bins-1, density=False)[1].tolist()
    a1=np.repeat(a1,2)

    verts, tri = triangulate_histogtam([m]*len(a0), a1, a0)
    x, y, z = verts.T
    I, J, K = tri.T
    fig.add_traces(go.Mesh3d(x=x, y=y, z=z, i=I, j=J, k=K, color=bar_color[m], opacity=0.7))

fig.update_layout(width=700, height=700, scene_camera_eye_z=0.8)

It works, maybe you can consider doing a PR.
This is great, but is there a way to modify this example so that it would work for a regular 2d dataset instead of a histogram? I am looking to plot a simple list of dates and values as x, y in the same way?