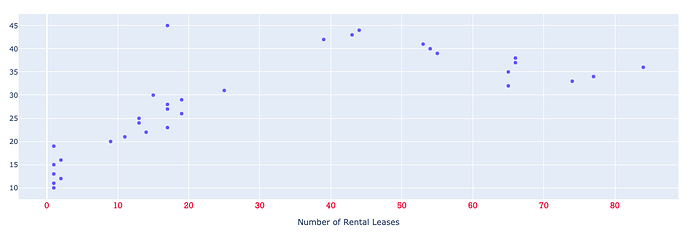
I have a plotly go.scatter plot and I’d like to add dashed line to annotate market equilibrium.
Here’s an example:

Code:
@app.callback(Output('price-graph', 'figure'),
              [
                 Input('submarket-select', 'value')
              ]
             )
def update_price(val):

    if val:

        fig1 = go.Figure(

            data=[go.Scatter(

                            x=dff['Count'],
                            y=dff['Price'],
                            mode='markers'

                            )
                  ],

            layout=go.Layout(

                xaxis=dict(
                    title='Number',
                    tickfont=dict(family='Rockwell', color='crimson', size=14)
                ),

                yaxis=dict(
                    title='Price ($ SF/Ft.)',
                    showticklabels=True
                ),

            )
        )

        return fig1

    else:

        return (no_update)
How do I add a dashed line connecting x and y axis?
