Hello all,
I would like to add a custom Contour over a Surface.
From this multi-surface plot:

fig_data = [
    go.Surface(contours=dict(), x=x, y=y, z=z,
               showscale=False,
               colorscale=colorscales[i],
               name='ID = {}'.format(i + 1))
    for i, id in enumerate(data)]

fig = go.Figure(data=fig_data)
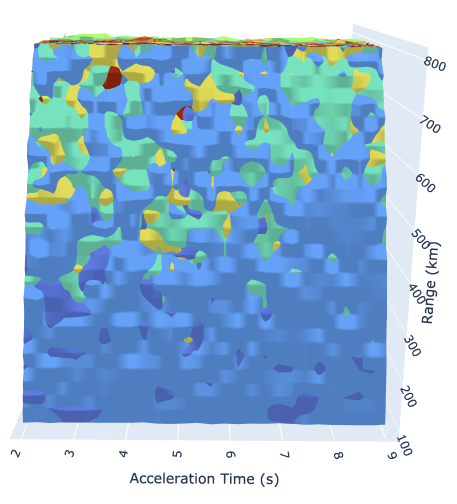
I have this Bottom view:
I would like to take this contours plot (that was generated separately):

fig = go.Figure(data=
go.Contour(
    z=min_costs, x=x, y=y,
    contours_coloring='lines',
    opacity=1,
    line_width=5,
    contours=dict(
        coloring='heatmap',
        showlabels=True,  # show labels on contours
        labelfont=dict(  # label font properties
            size=20,
            color='black',
        )
    )
))
To make something like this:
 .
.
How can I overlap this Contour to my surfaces?
The Contour I want to show is the min value in Z for all surfaces.