Hi all,
I made some changes to the code to use checkboxes into a datatable that I think is easy to understand.
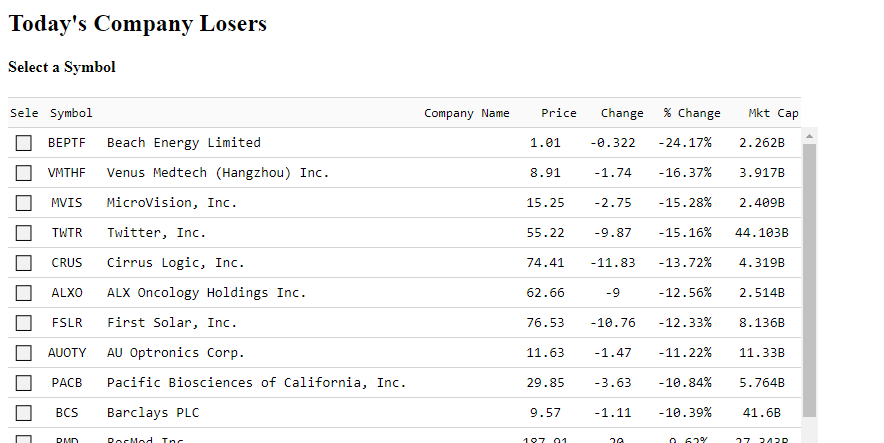
First example adds a first column with empty checkbox and when the user select/unselect any box it shows the selected/unselected information for that row and change the figure (emoji).
Note that if the user select anything outside the boxes nothing hapens.
First show the table with unselected checkboxes:
Then some box rows has been selected by the user:
And finally one selected box is unselected:
Here is the code:
import dash
import pandas as pd
from dash.dependencies import Input, Output, State
import dash_core_components as dcc
import dash_html_components as html
import dash_table
from dash.exceptions import PreventUpdate

# 1) this is needed to use emojis:
# -*- coding: utf-8 -*-

# table from Yahoo Finance
# define URL
urlyahoo = 'https://finance.yahoo.com/losers'
tables = pd.read_html(urlyahoo)
losers = pd.DataFrame(tables[0])
# Drop the columns that do not matters
losers.drop(['Volume', 'Avg Vol (3 month)', 'PE Ratio (TTM)', '52 Week Range'], axis='columns', inplace=True)
losers.columns = ['Symbol','Company Name','Price', 'Change', '% Change', 'Mkt Cap']
# 2) add first column with empty boxes:
losers.insert(0, 'Select', '⬜')

# create the tables to show the inforamtion
table = html.Div([
    dash_table.DataTable(
        columns=[{"name": i, "id": i} for i in losers.columns],
        data=losers.to_dict('records'),
        editable=False,
        style_as_list_view= True,
        style_data_conditional=[
            {'if': {'state': 'active'},'backgroundColor': 'white', 'border': '1px solid white'},
            {'if': {'column_id': 'Company Name'}, 'textAlign': 'left', 'text-indent': '10px', 'width':100},
            ],
        fixed_rows={'headers': True},
        id='table',
        style_data={"font-size" : "14px", 'width': 15, "background":"white", 'text-align': 'center'},
    )
])


app = dash.Dash(__name__)

# Layout of the page:
app.layout = html.Div([
    html.H2("Today's Company Losers"),
    html.H4("Select a Symbol", id="Message1"),
    html.Div(table, style={'width':'60%'})
])

# Callback
@app.callback(Output("Message1", "children"),
              Output("table", "data"),
              [Input('table', 'active_cell'),
               State('table', 'data')])
def update_loosers(cell,  data):
    # If there is not selection:
    if not cell:
        raise PreventUpdate
    else:
        # 3) If the user select a box of the "Select" column:
        if cell["column_id"] == 'Select':
            # takes info for some columns in the row selected
            symbol_selected = data[cell["row"]]["Symbol"]
            company_selected = data[cell["row"]]["Company Name"]
            message = "Last Symbol selected: - "+symbol_selected+" - Company Name:   "+company_selected

            # 4) Change the figure of the box selected
            if data[cell["row"]]["Select"] == '⬜':
                data[cell["row"]]["Select"] = '✅'
            else:
                # 5) if the user unselect the selected box:
                data[cell["row"]]["Select"] = '⬜'
                message = "The Symbol: - "+symbol_selected+" - Company Name:   "+company_selected+" has been unselected"

        # if other column is selected do nothing:
        else:
             raise PreventUpdate

        return message, data


if __name__ == "__main__":
    app.run_server(debug=True)
In the second example doesn’t matter wich column the user selects (except for the first one):
First it shows the table with empty checkboxes:
After some checkboxes are selected:
And when any selected box are unselected:
Here is the code:
import dash
import pandas as pd
from dash.dependencies import Input, Output, State
import dash_core_components as dcc
import dash_html_components as html
import dash_table
from dash.exceptions import PreventUpdate

# 1) this is needed to use emojis:
# -*- coding: utf-8 -*-

# # table with task and employees
# df_selection = pd.DataFrame(columns = ['Row','Column'])
#
# df_selection.to_csv('last_selected.csv')

# 2) table with task and employees with unselected boxes
df = pd.DataFrame(columns = ['Task', 'Employee 1', 'Employee 2', 'Employee 3', 'Employee 4', 'Employee 5', 'Employee 6', 'Employee 7',
                             'Employee 8'])
df['Task']= ["Task 1 ", "Task 2", "Task 3", "Task 4"]
df['Employee 1'] = ['⬜','⬜','⬜','⬜']
df['Employee 2'] = ['⬜','⬜','⬜','⬜']
df['Employee 3'] = ['⬜','⬜','⬜','⬜']
df['Employee 4'] = ['⬜','⬜','⬜','⬜']
df['Employee 5'] = ['⬜','⬜','⬜','⬜']
df['Employee 6'] = ['⬜','⬜','⬜','⬜']
df['Employee 7'] = ['⬜','⬜','⬜','⬜']
df['Employee 8'] = ['⬜','⬜','⬜','⬜']

# create the tables to show the inforamtion:
table = html.Div([
    dash_table.DataTable(
        columns=[{"name": i, "id": i} for i in df.columns],
        data=df.to_dict('records'),
        editable=False,
        style_data_conditional=[
        {'if': {'state': 'active'},'backgroundColor': 'white', 'border': '1px solid white'},
        ],
        style_as_list_view= True,
        column_selectable= 'single',
        id='table',
        style_data={"font-size" : "14px", 'width': 15, "background":"white", 'text-align': 'center'},
    )
])

app = dash.Dash(__name__)

# Layout of the page:
app.layout = html.Div([
    html.H2("Employees Tasks"),
    html.H4("All Tasks are empty", id="Message1"),
    html.Div(table, style={'width':'60%'}),
])

# Callbacks
@app.callback(Output("Message1", "children"),
              Output("table", "data"),
              [Input('table', 'active_cell'),
               State('table', 'data')])
def update_loosers(cell, data):
    # If there is not selection:
    if not cell:
        raise PreventUpdate
    else:
        # If the user select a box:
        # 3) takes the info for the row and column selected
        row_selected = cell["row"]
        row_name = data[row_selected]["Task"]
        column_selected =cell["column"]
        column_name =cell["column_id"]
        message = "Check a box"

        # 4) Change the figure of the box selected
        if data[row_selected][column_name] == '✅':
                data[row_selected][column_name] = '⬜'
                message = "The "+row_name+" of the "+column_name+" has been unselected"

        elif data[row_selected][column_name] == '⬜':
                  data[row_selected][column_name] = '✅'
                  message = "The "+row_name+" of the "+column_name+" has been completed"

        return message, data


if __name__ == "__main__":
    app.run_server(debug=True)


