Hi,
We are using Plotly JS. We want to create a parabola based on the coordinates. It occurs correctly in different systems with the same coordinates. Same coordinates on Plotly JS give a different result.
Can you help me ?


Data Set;
69.000000
69.000000
59.000000
59.000000
41.000000
49.000000
41.000000
49.000000
49.000000
49.000000
49.000000
65.000000
65.000000
65.000000
69.000000
69.000000
69.000000
69.000000
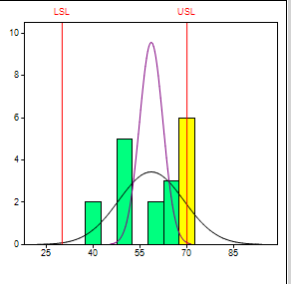
According to this data set, we create the following X and Y coordinates (CPK Graphics). If there is an error in these coordinates, do you have any information about the calculation?
X and Y Coordinates;
const x = [27.2393316076888, 30.9235932486143, 34.6078548895398, 38.2921165304653, 41.9763781713908, 45.6606398123163, 49.3449014532418, 53.0291630941673, 56.7134247350928, 60.3976863760183, 64.0819480169438, 67.7662096578693, 71.4504712987948, 75.1347329397203, 78.8189945806458, 82.5032562215713, 86.1875178624968, 89.8717795034223];
const y = [5.24381511845267E-22, 1.70220391370663E-17, 1.50818727225073E-13, 3.64735832438601E-10, 2.40758187296533E-07, 4.33773654638358E-05, 0.00213316648403246, 0.0286329308775286, 0.104902619141153, 0.104902619141153, 0.0286329308775283, 0.00213316648403242, 4.33773654638346E-05, 2.40758187296525E-07, 3.64735832438584E-10, 1.50818727225066E-13, 1.70220391370653E-17, 5.24381511845241E-22];