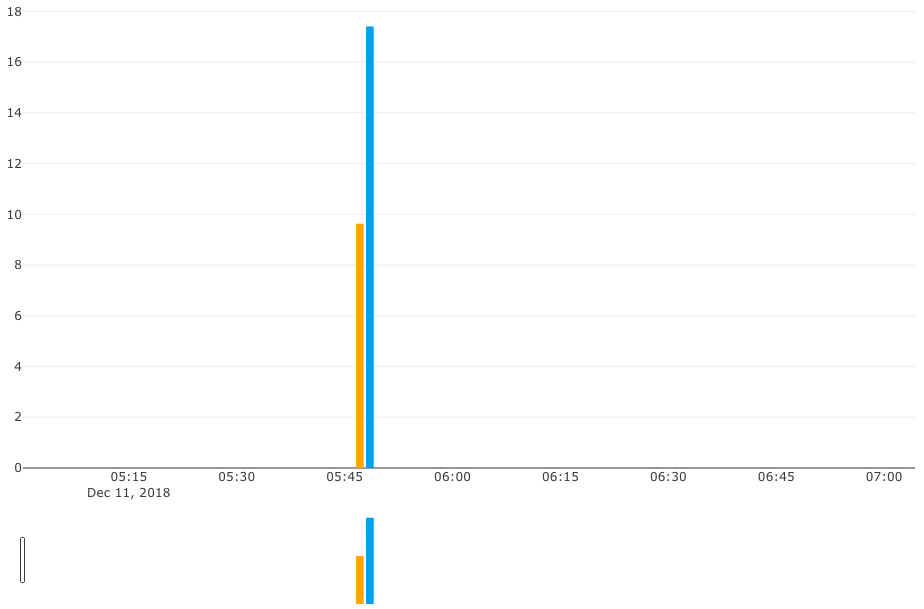
I am plotting bar chart with the slider range using react-plotly.js. The xaxis type of the chart is date. I feed in the axis range using a timepicker. When I select the time to be " today" i.e end time in the future, the chart display the xaxis in a reverse order.

Also, you will notice that it doesn’t display any bars even though there exists data during that timerange. Is this an issue with the date format ? or plotly doesn’t work with the future date ?
My plot configuration looks like :
const layout = {
title: this.state.chartTitle,
autosize: true,
dragmode: false,
margin: {
r: 0,
t: 50,
b: 100,
pad: 0,
autoexpand: true
},
hoverlabel: {
bgcolor: ‘rgba(0,0,0,1)’,
bordercolor: ‘rgba(200,200,200,1)’
},
width: this.state.layoutWidth,
height: ‘750’,
yaxis: {
          type: 'linear',
          showgrid: true
        },
        xaxis: {
          type: 'date',
          autorange: false,
          fixedrange: false, // true disables range selection on main graph
          showgrid: false,
          range: this.state.axisRange,
          rangeslider: {
            visible: true,
            range: this.state.sliderRange
          }
        }
Also, the time that I am feeding in is in unix format. Before applying to plotly, I am converting it to the datetime format. Is the format that I am applying to the chart correct ?
axisRange: [moment(1544418000000).format('YYYY-MM-DD hh:mm:ss'), moment(1544590799000).format('YYYY-MM-DD hh:mm:ss')],