$('#Same').click(function(){
  var seconds = document.getElementById("timer").value;
  //make sure inputs are fille out properly
  if (seconds == null || seconds == "" ) {
    alert("Seconds must be filled out");
  }
  // Run if filled out properly
  else {
    //GETTING VALUES OF THE FILLED OUT GRAPHED DATA
    var points = document.getElementById("point").value;
    var seconds = document.getElementById("timer").value;
    var title = document.getElementById("title").value;
    var x = document.getElementById("X").value;
    var y = document.getElementById("Y").value;
    var threshold = document.getElementById("threshold").value;
    //WILL LISTEN FOR MESSAGE BASED ON USERS TIMES, IF USER PICKS 5 SECONDS, THEN IT WILL LISTEN EVERY FIVE SECONDS.
    //GETTING DIV FOR PLOT
    var plotDiv = document.getElementById('myDiv1');
    //LAYOUT FOR PLOTLY GRAPH
    var layout = {
      margin: {
        l: 50,
        r: 50,
        b: 150,
        t: 100,
        pad: .1
      },
      hovermode:'closest',
      title: title,
      xaxis: {
        title: x,
        autorange: true,
        titlefont: {
          family: "Lato, Sans-serif",
          size: 18,
          color: "#002B7F"
        }
      },
      images: [
        {
          x: 1.01,
          y: .95,
          sizex: 0.3,
          sizey: 0.3,
          source: "graphlogo.png",
          xanchor: "left",
          xref: "paper",
          yanchor: "bottom",
          yref: "paper"
        }
      ],
      yaxis: {
        title: y,
        autorange:true,
        titlefont: {
          family: "Lato, Sans-serif",
          size: 18,
          color: "#002B7F"
        }
      }
    };
    var currentdate = new Date();
    var time =currentdate.getHours()%12 + ":" + currentdate.getMinutes() + ":" + currentdate.getSeconds() + ":" + currentdate.getMilliseconds();
    var trace1 = {
      x: [time],
      y: [],
    };

    //Creating the amount of graphs we need BASED ON OUTPUT DATA ARRAY SIZE
    var $graphs=jQuery('#graphs');
    var count=2;
    //IT IS GOING TO CREATE AS MANY TRACES AS ARRAY SIZE, SO IF WE WERE READING THREEE ADDRESSES, TWO TRACES WILL BE ADDED BC ONE IS ALREADY CREATED ABOVE
    socket.once('temp', function(temp){
      for (var i = 1, len = temp.length; i < len; i++) {
          Plotly.addTraces(myDiv1,{x: [time],y: []});
      };
    });


    //IF USER DOES WANT THRESHOLD VALUE
    if ( document.getElementById("threshold").value!='' && document.getElementById("threshold").value!=null) {
      document.getElementById('Scroll').innerHTML = "Scoll Down to see Graph";
      //CREATES PLOT WITH TRACE 1 VAR
      jQuery('<div>', {
        'class': 'myDiv2',
        'id': 'myDiv1',
      }).appendTo($graphs);
      var x=document.getElementById('myDiv' + count);
      var data = [trace1];
      Plotly.newPlot(myDiv1, data, layout);


      //CREATING LINE FOR THRESHOLD
      var update2 = {
        shapes: [
          {
            type: 'line',
            x0: 0,
            y0: threshold,
            x1: points,
            y1: threshold,
            line: {
              color: '#002B7F',
              width: 4,
            }
          }
        ]
      };
      //LIVE STREAMING GRAPH BASED ON USER'S TIME.. IT IS GOING TO UPDATE ALL TRACES WITH PROPER VALUES
      setInterval(function(){
        socket.once('temp', function(temp){
          for (var i = 0, len = temp.length; i < len; i++) {
            var currentdate = new Date();
            var time =currentdate.getHours()%12 + ":" + currentdate.getMinutes() + ":" + currentdate.getSeconds() + ":" + currentdate.getMilliseconds();
            var update = {
              x: [[time]],
              y: [[temp[i]]]
            };
            Plotly.relayout(myDiv1, update2)
            Plotly.extendTraces(myDiv1, update, [i], points);
          }
        });
      }, seconds * 1000);
      //ALLOWS USER TO CLICK ON POINT AND ALERT BOX OF POINT WILL SHOW
      myDiv1.on('plotly_click', function(data){
        var pts = '';
        for(var i=0; i < data.points.length; i++){
          pts = 'x = '+data.points[i].x +'\ny = '+
          data.points[i].y.toPrecision(6) + '\n\n';
        }
        alert('Data point clicked is located at:\n\n'+pts);
      });
    }
    else {
      //IF THERE IS NO THRESHOLD
      //SAME CODE AS ABOVE MINUS THE SHAPES FOR THRESHOLD LINE
      document.getElementById('Scroll').innerHTML = "Scoll Down to see Graph";
      jQuery('<div>', {
        'class': 'myDiv2',
        'id': 'myDiv1',
      }).appendTo($graphs);
      var x=document.getElementById('myDiv' + count);
      var data = [trace1];
      Plotly.newPlot(myDiv1, data, layout);
      setInterval(function(){
        socket.once('temp', function(temp){
            for (var i = 0, len = temp.length; i < len; i++) {
            var currentdate = new Date();
            var time =currentdate.getHours()%12 + ":" + currentdate.getMinutes() + ":" + currentdate.getSeconds() + ":" + currentdate.getMilliseconds();
            var update = {
              x: [[time]],
              y: [[temp[i]]]
            };
            Plotly.extendTraces(myDiv1, update, [i], points);
          }
        });
      }, seconds * 1000);
      myDiv1.on('plotly_click', function(data){
        var pts = '';
        for(var i=0; i < data.points.length; i++){
          pts = 'x = '+data.points[i].x +'\ny = '+
          data.points[i].y.toPrecision(6) + '\n\n';
        }
        alert('Data point clicked is located at:\n\n'+pts);
      });
    }
  }
});
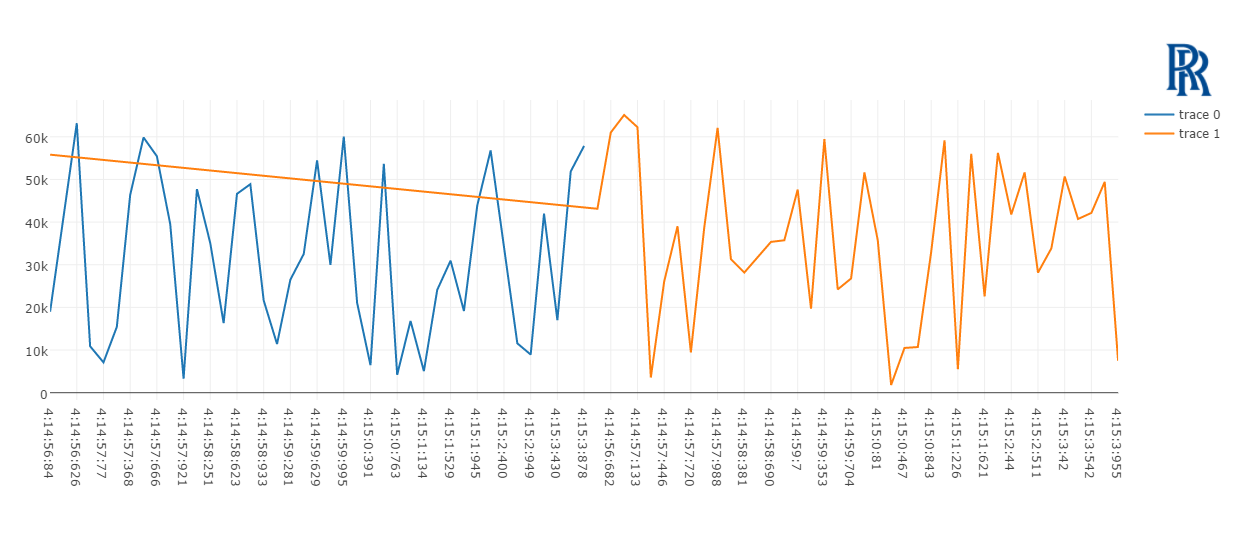
If you look at picture i uploaded, for some reason, the traces do not overlap each other but create identical axises, why is this?? I want it to overlap??