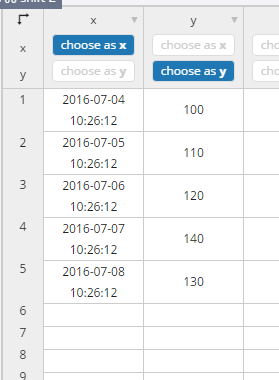
Hi guys, I’m trying to plot a simple line graph using value in my database which has a time stamp. I’ve successfully imported date and time into my graph’s grid.
But for my graph, it is not showing anything:

and the x-axis seems to be weird…
I’m new to Plotly, any help would be much appreciated