Hello,
I am using plotly with Shiny R.
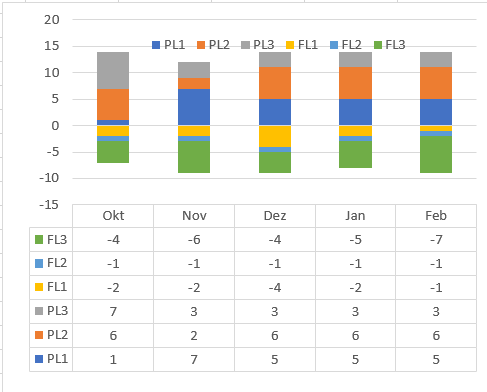
How can I visualize both: bar chart and the associated data table?
Thanks a lot for any advices.
Hello,
I am using plotly with Shiny R.
How can I visualize both: bar chart and the associated data table?
Thanks a lot for any advices.