hey, I have a project where I’m trying to represent timestamped data representative of different types of mutually exclusive events. The data in question is from activitywatch events. I’m trying to represent the user’s(/my) attentional drift. I have a list of events from the different buckets that has been merged and deduplicated.
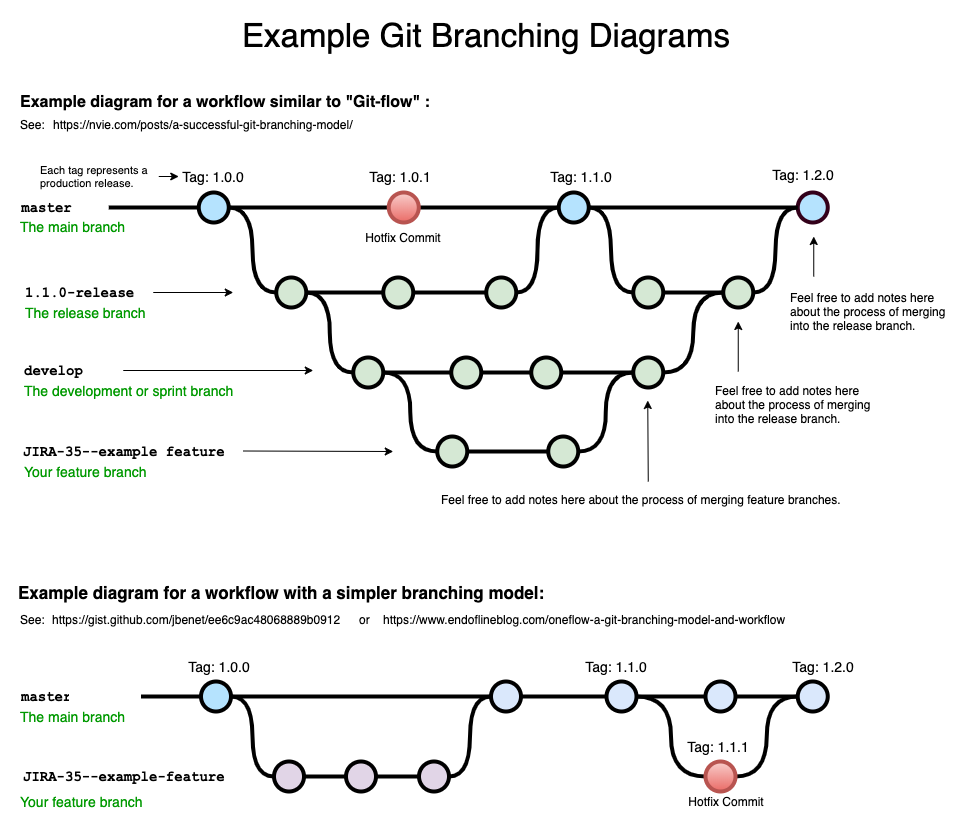
The most obvious way of representing this type of categorical time series (,to me,) is a horizontal git branch tree, save for a single connection between each node. each track is a different bucket, the dots are the individual events. the location along the x axis is determined by the timestamp. the arrow can either be solid, with a third category for afk events, or dotted if an afk event happens(saves space when looking at events across multiple host)
The only problem is I’m having trouble figuring out the relevant functions to make this from graph objects, could you guys point me in the right direction?