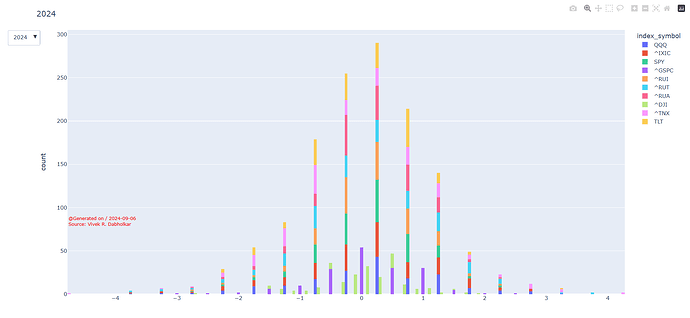
Use of Dropdown Menu for Histogram

I have a dataframe containing following columns:

  1. Date
  2. SPY (ticker) Daily % change
  3. QQQ Daily % change

I created a Histogram over the entire date range (24 years) for the data-Frame. It provides no. of counts for each bin of Daily % change.

I want to study how distribution changes as a function of year which I want to select from dropdown box containing a list of years [2000, 2001, … 2024]

How do I accomplish this?

Hi @vivek22

You would have to use Dash for that. Here’s the documentation for the dropdown component.

If you’re new to Dash, I’d highly recommend watching the video below to learn how to use the Dropdown as a Graph filter:

Thanks for the suggestion. With Dash one cannot save it as a self-contained html file

Hello @vivek22 !

I would suggest also to use Dash, but if you need to use only plotly, you can take a look here:

Maybe you can use a slider instead a dropdown if your variable is the year from 2000 to 2024, like the second example:

You can also play an animation through the years:

1 Like

Thank you sir! I will surely take a look.

I took a look, I could not find a solution to my problem.

1 Like

Hi @vivek22 ,

Hi maybe this example below can give alternative solution to your issues.

mport plotly.express as px
from datetime import datetime

df = px.data.tips()

df['date'] = df.day
df = df.replace({'date': {'Thur': datetime(2000,1,1),'Fri': datetime(2001,1,1),'Sat': datetime(2002,1,1),'Sun': datetime(2003,1,1)}})

# This example to make sure there are 3 columns like your post description
# column `date` is like Date
# column `total_bill`` is act like SPY (ticker) Daily % change
# column `tip` is act like QQQ Daily % change
df = df[["total_bill","tip","date"]]

# create new column year only
df['year'] = df.date.dt.year

# change column name if needed
df.columns=["SPY","QQQ","date","year"]

titles = []
xaxis_titles=[]

# create histogram based on how many combination that may be possible 
for col in ["SPY","QQQ"]:
	if titles:
		print("col",col)
		fig_temp = px.histogram(df, x=col, color="year")
		fig.add_traces(fig_temp.data)
	else:
		fig = px.histogram(df, x=col, color="year")

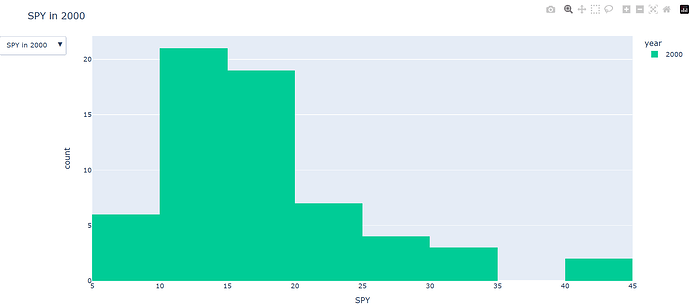
	titles += ['{} in {}'.format(col,year) for year in df.year.unique().tolist()]
	xaxis_titles += ['{}'.format(col) for year in df.year.unique().tolist()]

# at initial hide all plots except last one
fig.update_traces(dict(visible=False))
fig.data[0].visible=True


# create function to return list of visible plot
def get_visible(idx):
	visibles = [False] * len(fig.data)
	visibles[idx] = True
	return visibles

# buttons dropdown
buttons = [ dict(label=titles[idx],method="update",args=[{"visible": get_visible(idx)},{"title": titles[idx],"xaxis": {"title":xaxis_titles[idx]}}]) for idx,data in enumerate(fig.data)]


# create dropdown menu
fig.update_layout(
    updatemenus=[
        
        dict(
            active=0, # set the first label as seleceted plot 
            buttons=list(buttons),
        )
    ])


# Set first title and first xaxis title for initial display
fig.update_layout(title_text=titles[0],xaxis=dict(title=xaxis_titles[0]))
fig.show()

Hope you find your solution soon!

1 Like

Thanks a lot! I will definitely give it a shot and let you know. At first look, I think this soluton is very likely what I am looking for. I presume one can have two button types one for Index Type and other for the year!

Works like a charm! Are you in US? How can I send you a token of appreciation for your efforts?

It is possible to split into two sets of buttons, one for Index Symbol and the other for the Year. How can this be done?

1 Like

Hi @vivek22 ,

I’m not in US. I’m from Indonesia. I appreciate that.

Glad if help you.

Unfortunately by using this method, you can not create two buttons to create like “nested if” condition.
So the best scenario is create as many as possibility plots and keep control one selected plot by only one dropdown menu.

1 Like

Thanks a million! It already is a very big help, organizing the data!

1 Like

You are welcome!.

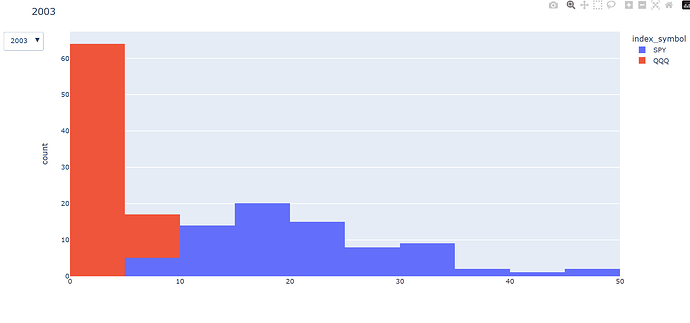
Alternatively, can one plot all indices at once for a given year as a button and then I can click indices to unselect individually?

What you mean is the dropdown button is a year list, and it will show all indices, and you will unselect the indices by clicking legend , is that right ?

Yes, that is correct. You can see previously plotting over all the years hard to tell for each year!

Yeah,
better split per year.

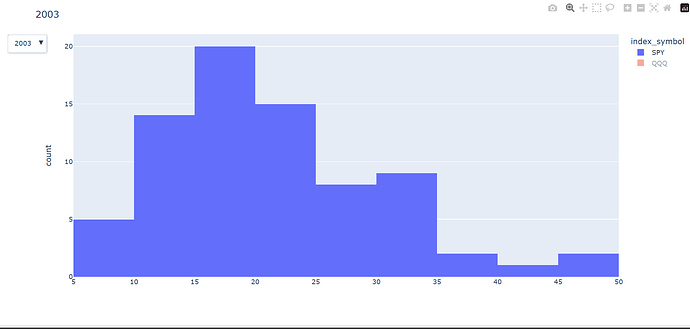
I have tried to your last scenario, if you still interested, please take a look :slight_smile: :

import plotly.express as px
import pandas as pd
from datetime import datetime

df = px.data.tips()

df['date'] = df.day
df = df.replace({'date': {'Thur': datetime(2000,1,1),'Fri': datetime(2001,1,1),'Sat': datetime(2002,1,1),'Sun': datetime(2003,1,1)}})

# This example to make sure there are 3 columns like your post description
# column `date` is like Date
# column `total_bill`` is act like SPY (ticker) Daily % change
# column `tip` is act like QQQ Daily % change
df = df[["total_bill","tip","date"]]

# create new column year only
df['year'] = df.date.dt.year

# change column name if needed
df.columns=["SPY","QQQ","date","year"]

# ignore date 
df = df[["SPY","QQQ","year"]]


# indices list
indices = ["SPY","QQQ"]

# melt data all indices
df = pd.melt(df, id_vars=['year'], value_vars=indices)


# chang columns
df.columns = ["year","index_symbol","value"]

# year
years = df.year.unique().tolist()


titles = []
xaxis_titles=[]

# create histogram based on how many combination that may be possible 
for year in years:
	df_year = df[df['year']==year]
	if titles:
		fig_temp = px.histogram(df_year, x="value", color="index_symbol")
		fig.add_traces(fig_temp.data)
	else:
		fig = px.histogram(df_year, x="value", color="index_symbol")

	titles += [year]
	xaxis_titles += ['']

print(len(fig.data))

# create function to return list of visible plot
def get_visible(idx):
	visibles = [False] * len(fig.data)

	for vis_idx in range(idx*len(indices),idx*len(indices)+len(indices)) :
		visibles[vis_idx] = True

	return visibles


# at initial hide all plots except first year
fig.update_traces(dict(visible=False))
for vis_idx in range(0, len(indices)):
	fig.data[vis_idx].visible=True


# buttons dropdown
buttons = [ dict(label=titles[idx],method="update",args=[{"visible": get_visible(idx)},{"title": titles[idx],"xaxis": {"title":xaxis_titles[idx]}}]) for idx,data in enumerate(years)]


# create dropdown menu
fig.update_layout(
    updatemenus=[
        
        dict(
            active=0, # set the first label as seleceted plot 
            buttons=list(buttons),
        )
    ])


# Set first title and first xaxis title for initial display
fig.update_layout(title_text=titles[0],xaxis=dict(title=xaxis_titles[0]))
fig.show()
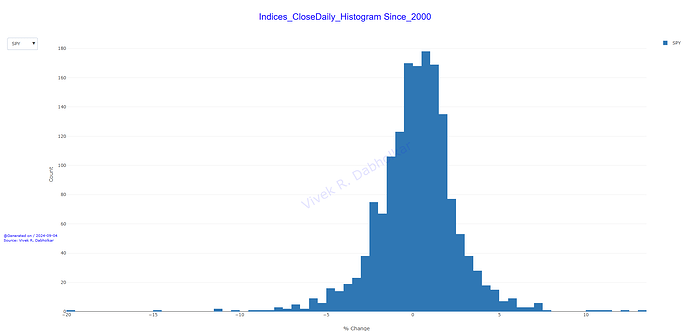
I definitely will! Thanks a bunch

Works Awesome! Thanks a Million.

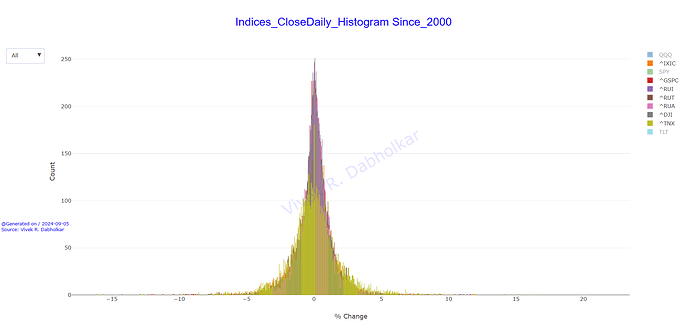
With minor formatting

1 Like

Hi @vivek22 .
Wow, in your second image looks great.

By adding minor formatting and selecting necessary index will output better plot.

Very pleasing to watch and much more informative . well done! :+1:

Thank you Sir! Appreciate it. I also did reverse, i.e., select Symbol by Drop-down Box and it displays all years of data. All based on your code!

Would you consider including it under Show-and-Tell? I have put down your reference in my code!

I would love to, thank you.
But should I create different thread or just adding new tags ?