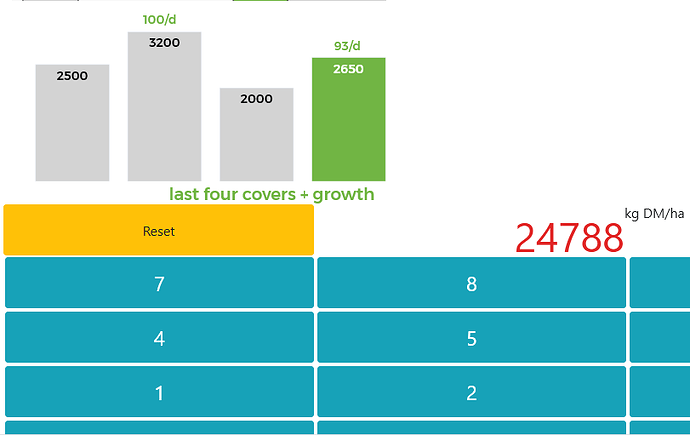
I’ve created a key pad functionality to enter in values. That is working fine but I now want to update a graph based on the entered value. This is my call back but “figure = last_four_covers(df_latest_covers, first_pdk)” is not enacting the bar graph update once I get to four digits:
@app.callback(
    Output('output', 'children'),
    Output('previous_cover', 'data'),
    Output('latest-covers', 'data'),
    Output('last-four_covers', 'figure'),
    [Input('button-1', 'n_clicks'),
     Input('button-2', 'n_clicks'),
     Input('button-3', 'n_clicks'),
     Input('button-4', 'n_clicks'),
     Input('button-5', 'n_clicks'),
     Input('button-6', 'n_clicks'),
     Input('button-7', 'n_clicks'),
     Input('button-8', 'n_clicks'),
     Input('button-9', 'n_clicks'),
     Input('button-0', 'n_clicks'),
     Input('button-00', 'n_clicks'),
     Input('output', 'children'),
     Input('latest-covers', 'data'),
     State('previous_cover', 'data'),
     State('last-four_covers', 'figure')])
def display_output(button_1, button_2, button_3,
                   button_4, button_5, button_6, button_7,
                   button_8, button_9, button_0, button_00, state, df_latest_covers,
                   prev_cover, figure):
    df_latest_covers = pd.read_json(df_latest_covers)
    ctx = dash.callback_context
    if not ctx.triggered:
        return ''
    else:
        button_id = ctx.triggered[0]['prop_id'].split('.')[0]
        if button_id == 'button-00':
            button_value = str(button_id.split('-')[-1])
        else:
            button_value = str(button_id.split('-')[-1])
        if prev_cover != None:
            curr_cover = prev_cover + str(button_value)
            prev_cover = curr_cover
            if len(curr_cover) == 4:
                int_curr_cover = int(curr_cover)
                df_latest_covers.loc[df_latest_covers['Paddock'] == '21',
                                     df_latest_covers.columns[-1]] = int_curr_cover
                figure = last_four_covers(df_latest_covers, first_pdk)
                df_latest_covers.to_csv('new_df.csv', index=False)
            else: exit
        else:
            curr_cover = str(button_value)
            prev_cover = curr_cover
        return curr_cover, prev_cover, df_latest_covers.to_json(), figure
The last_four_covers function is:
def last_four_covers(df_covers, first_pdk):
    aimer_green = '#71B544'
    aimer_error_red = '#E02626'
    aimer_jungle_green = '#031F24'
    aimer_dark_grey = '#8A8A8A'
    aimer_light_grey = '#FAFAFA'
    aimer_font_light = "Montserrat Light"
    aimer_font_bold = "Montserrat"
    font_size = 14
    current_pdk = first_pdk
    date_format ='%d-%m-%Y'
    df_latest_four = pd.concat([df_covers.iloc[:,0:5],df_covers.iloc[:,-4:]],axis = 1)
    title = 'last four covers + growth'
    df_latest_four_long = pd.melt(df_latest_four, id_vars=df_latest_four.columns[[0,1, 2, 3, 4]],
                             value_vars=df_latest_four.columns[5:])
    df_latest_four_long['Date'] = df_latest_four_long.variable.str[-8:]
    df_latest_four_long['Date'] = pd.to_datetime(df_latest_four_long['Date']).dt.strftime('%d/%m/%Y')
    df_latest_four_long['Date'] = pd.to_datetime(df_latest_four_long['Date'], format='%d/%m/%Y')
    df_latest_four_long = df_latest_four_long.sort_values(by=['Date', 'value'], ascending=[True, False])
    df_latest_four_long['Order'] = df_latest_four_long.groupby("Paddock")["Date"].rank()
    df_latest_four_long_pdk = df_latest_four_long.loc[df_latest_four_long['Paddock'] == current_pdk]
    df_latest_four_long_pdk['Date'] = pd.to_datetime(df_latest_four_long_pdk['Date']).dt.strftime(date_format)
    df_latest_four_long_pdk['Date'] = pd.to_datetime(df_latest_four_long_pdk['Date'], dayfirst=True)
    df_latest_four_long_pdk = df_latest_four_long_pdk.assign(days_since=df_latest_four_long_pdk.sort_values('Date', ascending=False).Date.diff(-1).dt.days.fillna(0))
    df_latest_four_long_pdk['diff_cover'] = df_latest_four_long_pdk.groupby(['Paddock'])['value'].transform(lambda x: x.diff())
    df_latest_four_long_pdk['gr_since'] = np.NaN
    df_latest_four_long_pdk.loc[(df_latest_four_long_pdk['diff_cover'] > 0) & (df_latest_four_long_pdk['days_since'] < 40), 'gr_since'] = (df_latest_four_long_pdk.diff_cover/df_latest_four_long_pdk.days_since).round(0)
    # hack to fix 30 Sept Thomson
    df_latest_four_long_pdk.loc[(df_latest_four_long_pdk['diff_cover'] < 300) & (df_latest_four_long_pdk['days_since'] == 40), 'gr_since'] = np.NaN
    df_latest_four_long_pdk['doy'] = df_latest_four_long_pdk['Date'].dt.dayofyear
    df_latest_four_long_pdk['month'] = df_latest_four_long_pdk['Date'].dt.month
    df_latest_four_long_pdk['jul_day'] = pd.DatetimeIndex(df_latest_four_long_pdk['Date']).to_julian_date()
    df_latest_four_long_pdk['Date Present'] = df_latest_four_long_pdk['Date'].dt.strftime('%d %b')
    #developing a bar graph to represent the latest feed wedge
    colors = ['lightgrey', 'lightgrey', 'lightgrey', aimer_green]
    fig = go.Figure(data=[go.Bar(x=df_latest_four_long_pdk['Order'],
                                 y=df_latest_four_long_pdk['value'],
                                 text=df_latest_four_long_pdk['value'],
                                 textposition='inside',
                                 textfont=dict(family=aimer_font_bold,
                                               size=font_size,
                                               color=['black', 'black', 'black', 'white']),
                                 customdata=df_latest_four_long_pdk[['Paddock', 'Date Present']],
                                 hovertemplate ='<extra></extra><b>Paddock %{customdata[0]}</b><br>' + '%{y} kg DM/ha<br>' + '%{customdata[1]}',
                                 marker_color=colors)]) # marker color can be a single color value or an iterable)])
    print(df_latest_four_long_pdk[['value']].head(4))
    #formating the bar graph
    fig.update_layout(font=dict(family="Montserrat", size=font_size, color='Dark gray'),
                      margin=dict(l=0, r=0, t=0, b=0),
                      paper_bgcolor="White",
                      plot_bgcolor='rgba(0,0,0,0)',
                      title_x=0.95, title_y=0.02,
                      showlegend=False)
    #formating the y axis and title
    fig.update_yaxes(title_text='',
                     showgrid=False,
                     showline=False,
                     showticklabels=False,
                     range=[0,df_latest_four_long_pdk['value'].max()+500])
    #formating the x axis and title
    fig.update_xaxes(title_text='',
                     showgrid=False,
                     showline=False,
                     showticklabels=False)
    fig.update_layout(title_text="last four covers + growth", font=dict(
            family=aimer_font_bold,
            size=font_size,
            color=aimer_green))
    fig.add_trace(go.Scatter(
        x=df_latest_four_long_pdk['Order'],
        y=df_latest_four_long_pdk['gr_since']+df_latest_four_long_pdk['value'],
        mode="text",
        text=df_latest_four_long_pdk['gr_since'],
        textposition="top left",
        textfont=dict(
            family=aimer_font_bold,
            size=font_size,
            color=aimer_green))
                 )
    fig.add_trace(go.Scatter(
        x=df_latest_four_long_pdk['Order'],
        y=df_latest_four_long_pdk['gr_since']+df_latest_four_long_pdk['value'],
        mode="text",
        text="/d",
        textposition="top right",
        textfont=dict(
            family=aimer_font_bold,
            size=font_size,
            color=aimer_green)))
    fig.update_layout(autosize=True,
                      width=40,
                      height=40)
    return dcc.Graph(id='last-four_covers', figure=fig, responsive=True,
                     style={'width': '50vh', 'height': '25vh'},
                     config={'displayModeBar': False})
The error message is:

In fact once I hit a 4th button it doubles up the last value and doesn’t update the graph above the value
