Dear Plotly community,
I am trying to make an interactive choropleth_mapbox plot, where the user can select the dataset to be shown via a button. The plot itself works fine, I cannot get it to update, though. This is the relevant part of my code:
import plotly.express as px

fig = px.choropleth_mapbox(df2, geojson=zipcodes, locations='PLZ', color='Set A',featureidkey="properties.postcode",
                           color_continuous_scale="Viridis",
                           mapbox_style="carto-positron",
                           zoom=8, center = {"lat": 51.961563, "lon": 7.628202},
                           opacity=0.5,
                           hover_data=["Ort", "Set A", "Set B", "PLZ"],
                           labels={'Ort':'Ort'}
                          )
fig.update_layout(margin={"r":0,"t":0,"l":0,"b":0})
fig.update_layout(dict(mapbox_style='open-street-map'))
fig.update_layout(
    updatemenus=[
        dict(
            type="buttons",
            direction='down',
            buttons=[

                dict(label="Set A",
                     method="update",
                     args=[{"color": "Set A"}
                          ]),
                dict(label="Set B",
                     method="update",
                     args=[{"color": "Set B"}
                          ]),

            ],
        )
    ]
)
fig.show()
fig.write_html("test_map.html")
I tried different “methods” for the buttons, i.e. “relayout”, “update”, “restyle”, but to no avail.
I get the feeling that it doesn’t work like at all, but hopefully I am just missing something. Any ideas are much appreciated!
Best,
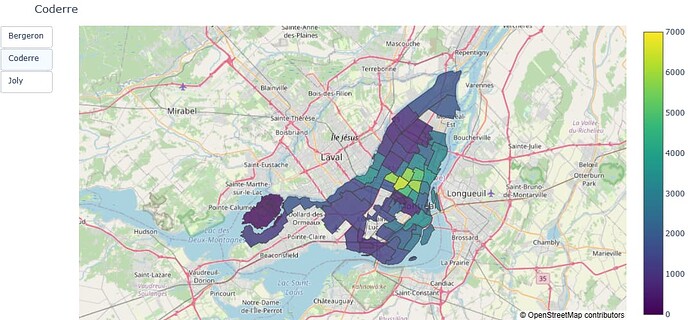
Since it is easiest to specify the entire map for each button and show/hide it, I created the code for your question based on the example in the reference.
I created it using a graph object instead of plotly.express. the association between geojson and user data must be a string, so I changed the type. specify the target column from the list of 3 candidate names and hide them all.
Only the first map is updated to display. Give the button input a list of display and hide.
import plotly.express as px
import plotly.graph_objects as go

df = px.data.election()
geojson = px.data.election_geojson()

df.district_id = df.district_id.astype(str)

fig = go.Figure()

for c in ['Coderre','Bergeron','Joly']:
    fig.add_trace(go.Choroplethmapbox(
        geojson=geojson,
        locations=df.district_id,
        z=df[c],
        featureidkey="id",
        colorscale="Viridis",
        zmin=0,
        zmax=7000,
        marker_opacity=0.8,
        marker_line_width=1,
        visible=False
    ))
    fig.update_layout(
        mapbox_style="open-street-map",
        mapbox_zoom=9,
        mapbox_center={"lat": 45.5517, "lon": -73.7073},
    )

fig.data[0].visible = True


fig.update_layout(
    updatemenus=[
        dict(
            type="buttons",
            direction='down',
            buttons=[

                dict(label="Bergeron",
                     method="update",
                     args=[{'visible':  [True, False, False]}, {'title': 'Bergeron'}
                          ]),
                dict(label="Coderre",
                     method="update",
                     args=[{'visible':  [False, True, False]}, {'title': 'Coderre'}
                          ]),
                dict(label="Joly",
                     method="update",
                     args=[{'visible':  [False, False, True]}, {'title': 'Joly'}
                          ]),

            ],
        )
    ]
)

fig.update_layout(margin={"r":0,"t":40,"l":0,"b":0}, height=500)
fig.show()
Thanks a lot, that worked like a charm!
One subsequent question: If I append lots of datasets, the html file I obtain with fig.write_html() becomes quite large. I suppose this is due to the fact that all data is saved again, i.e. about 25 MB per dataset in my case.
Is there any way to reduce the scope of the world map, as I only need a relatively small area, or use a less detailed map?
I have tried:
fig.write_html("thefilename.html",full_html=False, include_plotlyjs='cdn')
but the effect is only marginal.
I don’t think the large file size is a dealbreaker for me (as long as my browser does not crash or becomes unresponsive, I’ll need to test the version with all datasets included), but a more elegant solution would still be preferable…
Thanks again and best,
The method I proposed is to switch the map of 3, so naturally the file size will be larger. html files can be made lighter by using CDN, which you have already done, or by reducing the accuracy of the polygons in the original geojson so that there is less geometry information, which will reduce the html file size. It is presumed that the file size will be reduced. I don’t know because I haven’t verified this, but I don’t think there is any change in the size of the map as long as the size of the geojson used remains the same, even if you reduce the extent of the map.
Yes, indeed. In my case, I could solve that problem by just omitting all polygons I did not need (I only needed the zipcodes within a certain region, my loaded file contained all zipcode polygons for the whole country though).
Probably not the right solution for everyone in general, but I heavily underestimated the data size of the polygon data, and figured it would be due to the world map data…
Thanks a lot for your help!
Best


