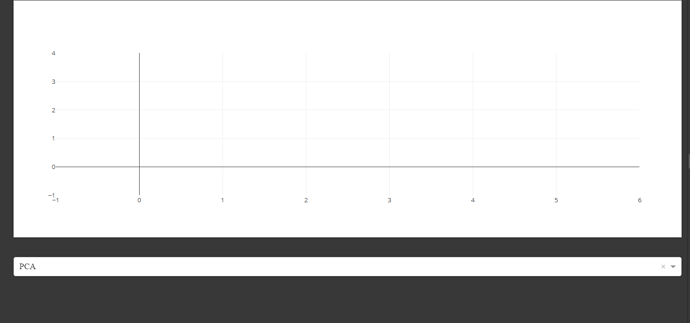
from sklearn.datasets import load_iris
import numpy as np
import pandas as pd
from jupyter_dash import JupyterDash
from dash import dcc, html, Input, Output, no_update
import plotly.express as px


app = JupyterDash(__name__)
app.layout = html.Div([

          dcc.Graph(
            id='graph'),

         html.Br(),

         html.Br(),

         dcc.Dropdown(
                id='dropdown',
                options=[{'label': i, 'value': i} for i in ['PCA', 'TSNE' , 'UMAP']],
                value='PCA'
            ),


])

#Define callback to update graph
@app.callback(
    Output(component_id='graph', component_property='fig'),
    Input(component_id='dropdown', component_property='value')
    )

def update_figure(value):
   if value == 'PCA':
      pca  = df
      fig = px.scatter(x=pca['column1'], y=pca['column2'] ,  color = pca['column1']  , labels=dict( x ="PCA1", y ="PCA2") , color_continuous_scale='ice' )
      return fig

   elif value == 'TSNE':
        tsne = df_tsne
        fig = px.scatter(x= tsne['column1'], y=tsne['column2'] , color = tsne['column1']  , labels=dict( x =" TSNE1", y ="TSNE2") , color_continuous_scale='Agsunset' )
        return fig

   else:
        umap = df_umap
        fig = px.scatter(x= umap['column1'], y=umap['column2'] , color = umap['column1']  , labels=dict( x =" Umap1", y ="Umap2") , color_continuous_scale='ice' )
        return fig


#Run app and display result inline in the notebook
app.run_server(mode = 'inline' , debug = True)
Hi,
Here’s one problem. The component property in the Output should be “figure”, not “fig”. So:
@app.callback(
    Output(component_id='graph', component_property='figure'),
    Input(component_id='dropdown', component_property='value')
 )
#...
Does it fix the problem?
yes I fixed that … thank you !
still unable to get the values in the graph
I can’t see anything else wrong with your code, but it is hard to say without seeing the data. Are there any errors thrown?
I was able to fix it … I changed the dropdown for loop and added labels individually and it worked.
