I can plot a 3D scatter plot with around 1.03 million points by their xyz coordinates, as shown below.
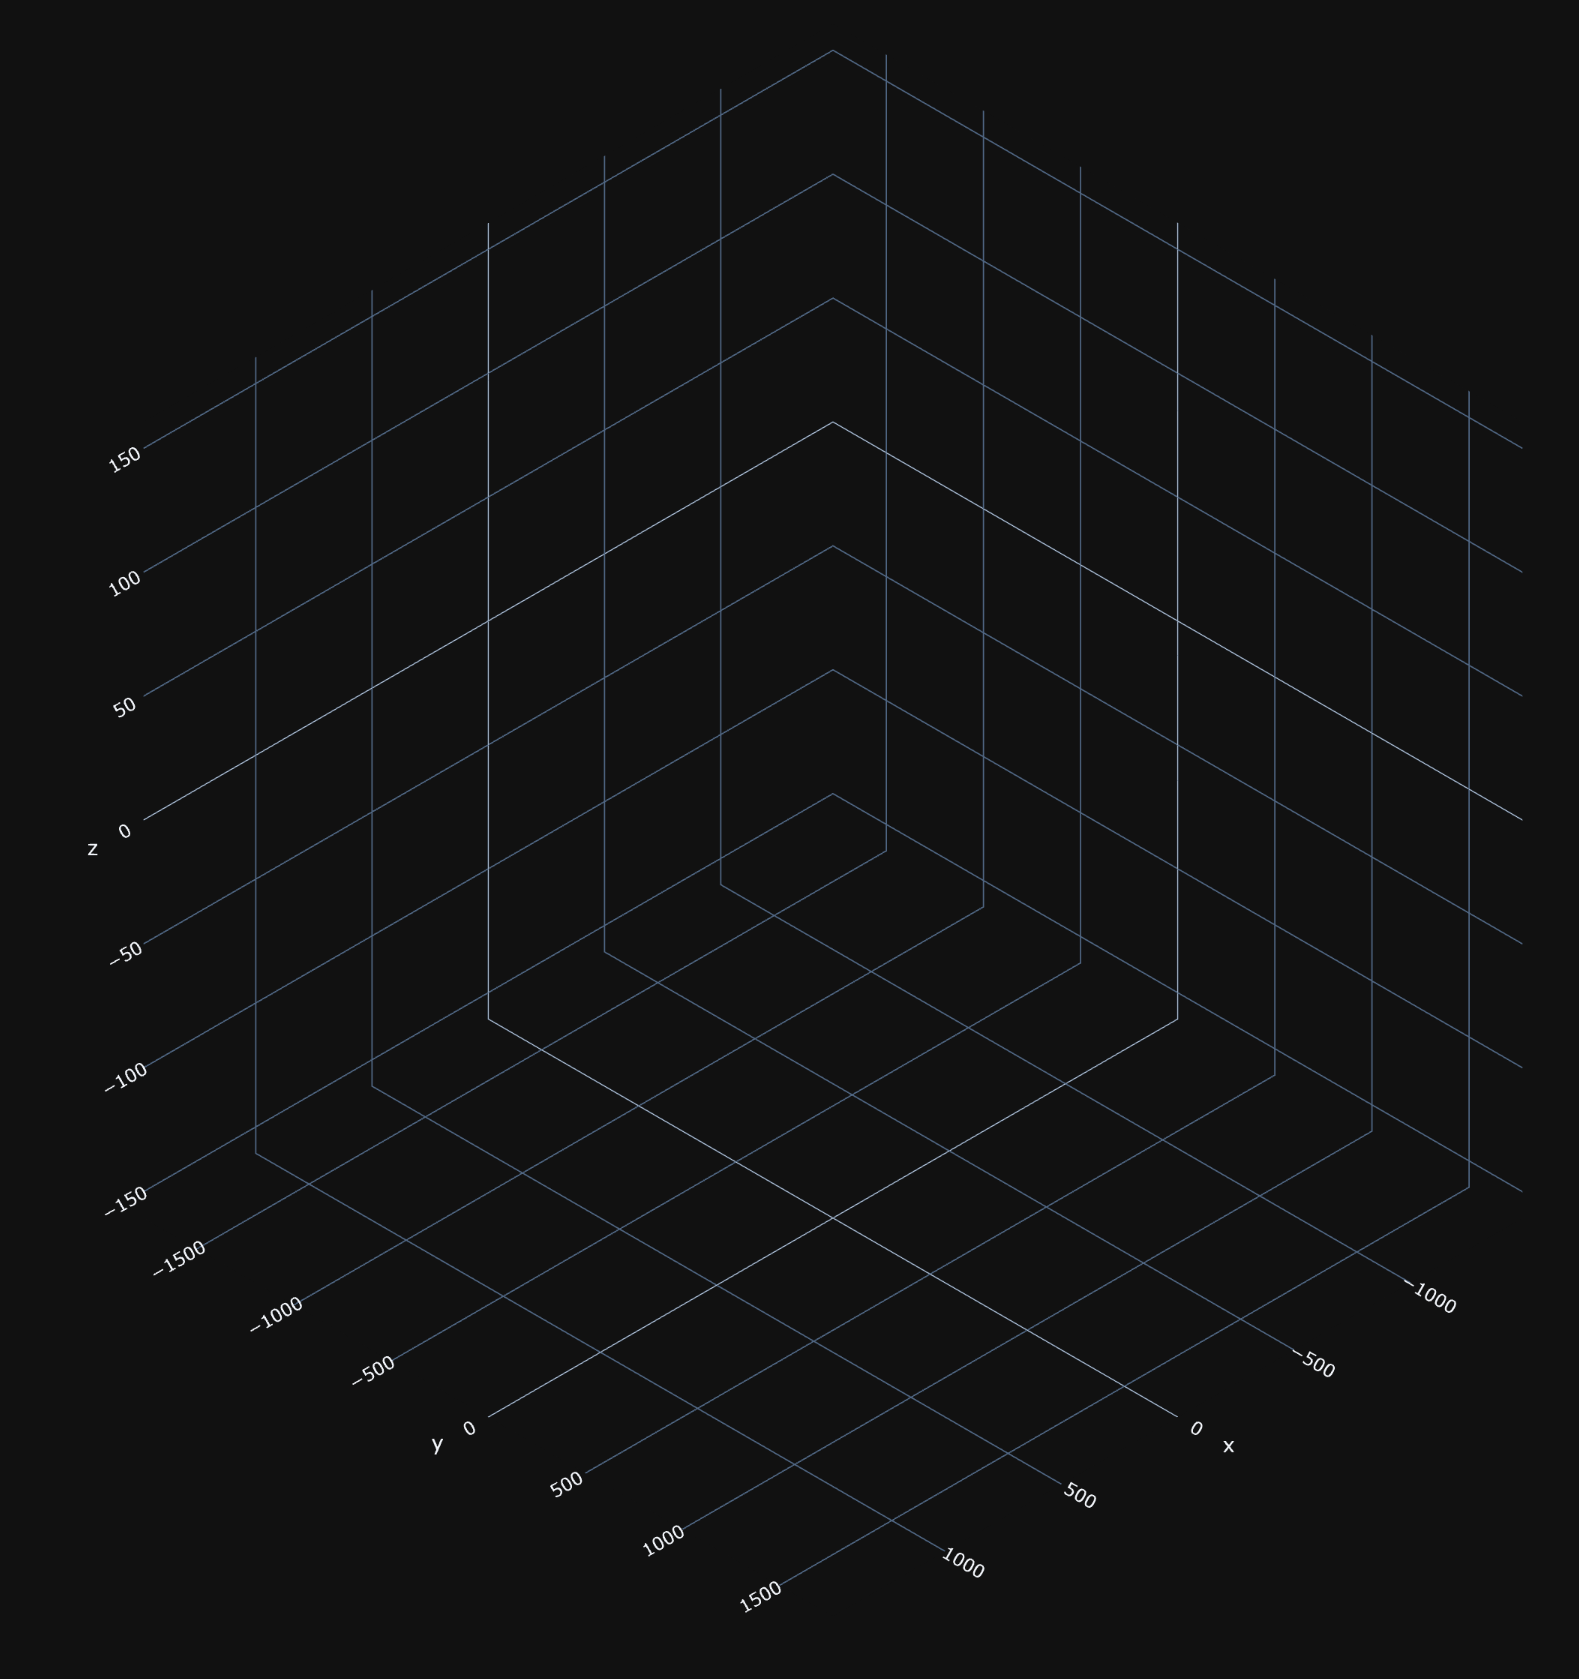
However, there is no 3D scatter plot shown if the number of points exceeds this amount, and sometimes, I got a 3D scatter plot with only the three axis as shown in the third image below.
May I ask if there is a upper limit of data point for 3D scatter plot? How to plot more than one million points efficiently?
I think plotly might not be the right tool for displaying of this amount of points, at least I did not find a proper solution. Maybe this gives you a starting point: