Two shared y axes on subplot with one row and two columns

I want to draw a subplot with two shared y axes and add a sync instruction between these two y axes. When I use shared_yaxes=True in make_subplots function I have two y axes with the same range. When I choose shared_yaxes=False zoom button on the right subplot doesn’t work correctly.
Screen with shared_yaxes=True. Two y axes have the same range.


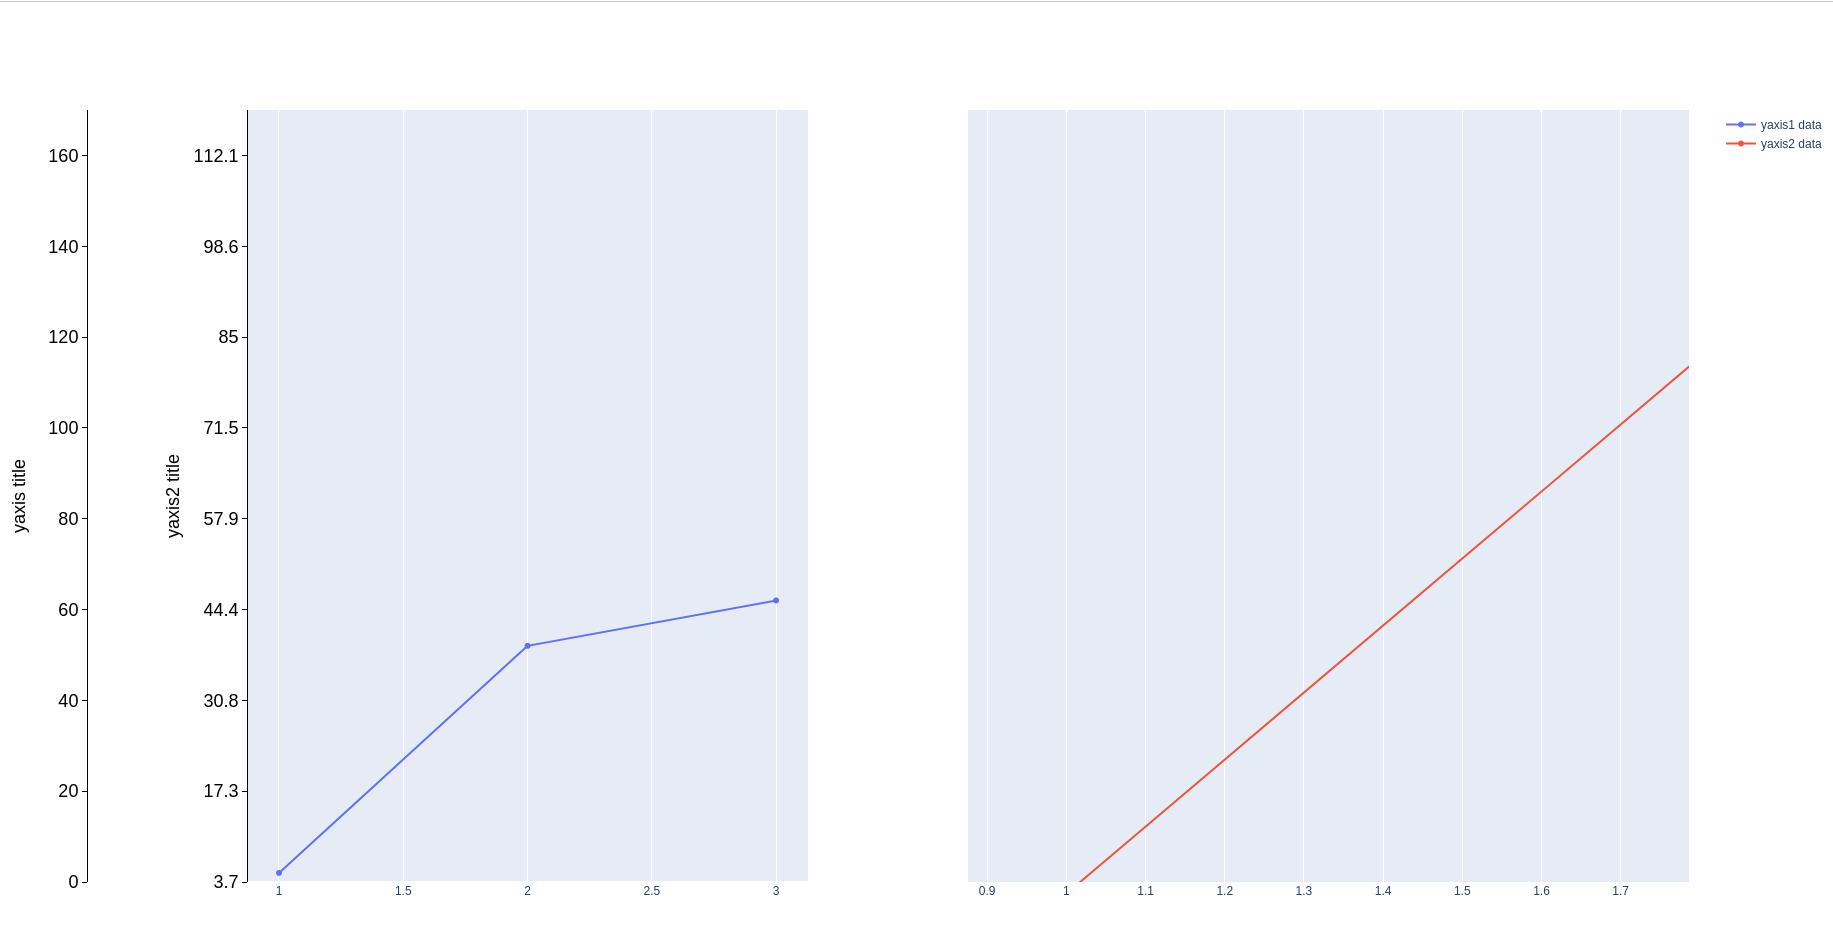
Screen with shared_yaxes=False

I want a picture like on the second screen, but with correctly zooming on both y axes when I zoom the right subplot.
Code listing

import plotly.graph_objects as go
from plotly.subplots import make_subplots

fig = make_subplots(rows=1, cols=2)

# Top left
fig.add_trace(
    go.Scatter(x=[1, 2, 3], y=[2, 52, 62], name="yaxis1 data"),
    row=1, col=1)

# Top right
fig.add_trace(
    go.Scatter(x=[1, 2, 3], y=[2, 102, 162], name="yaxis2 data"),
    row=1, col=2
)

fig.update_layout(yaxis2=dict(
        title="yaxis2 title",
        anchor="free",
        overlaying="y",
        titlefont=dict(color="Black",
                           size=18),
        tickfont=dict(color="Black",
                      size=18),
        linecolor='black',
        griddash="dash",
        gridwidth=0.4,
        gridcolor="#e0e0e0",
        mirror=True,
        showline=True,
        ticks="outside",
        tickwidth=1,
        tickcolor='black',
        ticklen=5,
        showgrid=False,
        showticklabels=True,
        position=0.1,
        side='left',
        tickmode="sync",
    range=[0, 170]
        ),
    yaxis=dict(
        title="yaxis title",
        anchor="free",
        titlefont=dict(color="Black",
                           size=18),
        tickfont=dict(color="Black",
                      size=18),
        linecolor='black',
        griddash="dash",
        gridwidth=0.4,
        gridcolor="#e0e0e0",
        mirror=True,
        showline=True,
        ticks="outside",
        tickwidth=1,
        tickcolor='black',
        ticklen=5,
        showgrid=False,
        showticklabels=True,
        position=0.0,
        side='left',
        range=[0, 70]
        ),
    xaxis=dict(domain=[0.1, 0.45])
    )

fig.write_html('tmp.html')

Hey @Vladislav_Velikan,

It seems the zooming property work as expected given the code you provided… You can confirm that by arranging the range of both figures as range=[0, 170]. Selecting an upper bond range that contains range of both data points could be a better approach for the cases as yours.

The reason that you see a zoom-like behavior in the first image is your data points exceed the set range of your figure.

Cheers!

That’s the point. I want two y axes with different range.

Ahh, sorry I misunderstood your question.
'shared_yaxes = 'columns' should solve your problem.

Cheers!

I think that this line doesn’t solve a problem. May be I will explain differently.
Screen before zoom


Zoom applying

Zoom result

A range of the first left y axes was not changed. How can I fix it?

try this one, maybe

import plotly.graph_objects as go
from plotly.subplots import make_subplots

fig = make_subplots(rows=1, cols=2, shared_yaxes = 'columns')

# Top left
fig.add_trace(
    go.Scatter(x=[1, 2, 3], y=[2, 52, 62], name="yaxis1 data"),
    row=1, col=1)

# Top right
fig.add_trace(
    go.Scatter(x=[1, 2, 3], y=[2, 102, 162], name="yaxis2 data"),
    row=1, col=2,
)

fig.update_layout(yaxis2=dict(
        title="yaxis2 title",
        anchor="free",
        overlaying="y",
        titlefont=dict(color="Black",
                           size=18),
        tickfont=dict(color="Black",
                      size=18),
        linecolor='black',
        griddash="dash",
        gridwidth=0.4,
        gridcolor="#e0e0e0",
        mirror=True,
        showline=True,
        ticks="outside",
        tickwidth=1,
        tickcolor='black',
        ticklen=5,
        showgrid=False,
        showticklabels=True,
        position=0.1,
        side='left',
        tickmode="sync",
    range=[0, 170]
        ),
    yaxis=dict(
        title="yaxis title",
        anchor="free",
        titlefont=dict(color="Black",
                           size=18),
        tickfont=dict(color="Black",
                      size=18),
        linecolor='black',
        griddash="dash",
        gridwidth=0.4,
        gridcolor="#e0e0e0",
        mirror=True,
        showline=True,
        ticks="outside",
        tickwidth=1,
        tickcolor='black',
        ticklen=5,
        showgrid=False,
        showticklabels=True,
        position=0.0,
        side='left',
        range=[0, 70]
        ),
    xaxis=dict(domain=[0.1, 0.45])
    )

fig.write_html('tmp.html')

fig.show()

It seems like the zoom property work as expected in your last example. Why do you think it does not?

Ithink he wants to synchronize the zoom in both columns. But I’m not sure if this is possible using plotly. I created an example using dash a while ago for a similar question.

Zoom works only for yaxis2. I want zoom to be applied and for yaxis1 too.

It can’t really have two different y-axis if you want a shared y-axis.

I would do it like this.

import plotly.graph_objects as go
from plotly.subplots import make_subplots

fig = make_subplots(rows=1, cols=2, shared_yaxes=True, horizontal_spacing=0.03,  subplot_titles=("yaxis1", "yaxis2"))

# Top left
fig.add_trace(
    go.Scatter(x=[1, 2, 3], y=[2, 52, 62], name="yaxis1 data"),
    row=1, col=1)

# Top right
fig.add_trace(
    go.Scatter(x=[1, 2, 3], y=[2, 102, 162], name="yaxis2 data"),
    row=1, col=2
)

fig.update_layout(yaxis2=dict(
        anchor="free",
        griddash="dash",
        gridwidth=0.4,
        mirror=True,
        showgrid=True,
        gridcolor='rgba(0, 0, 0, 0.4)',


        ),
    yaxis=dict(
   
        anchor="free",
        titlefont=dict(color="Black",
                           size=18),
        tickfont=dict(color="Black",
                      size=18),
        griddash="dash",
        gridwidth=0.4,
        mirror=True,
        showgrid=True,
        gridcolor='rgba(0, 0, 0, 0.4)',
 
 
        ),
    # xaxis=dict(domain=[0.1, 0.45])
    )

fig.update_layout(
plot_bgcolor='rgba(0,0,0,0)',
#paper_bgcolor='rgba(0,0,0,0)',

)
fig.show()

It wont’t work for me. Two different yaxis are used for two different physical properties. It is just a simple example to find a working solution.

Good advice! He can also choose to use only one figure, instead of subplots, with two y-axes.

But I need different x axes for each subplot.

I don’t think it will be possible if they both are not matched to the the same range unless it’s okay for one of them to be very zoomed in when first shown like in the example you provided.

You essentally want two different plots that share zoom, which you could achievein a dash app using relayoutdata not in plotly itself.