Hello Community,
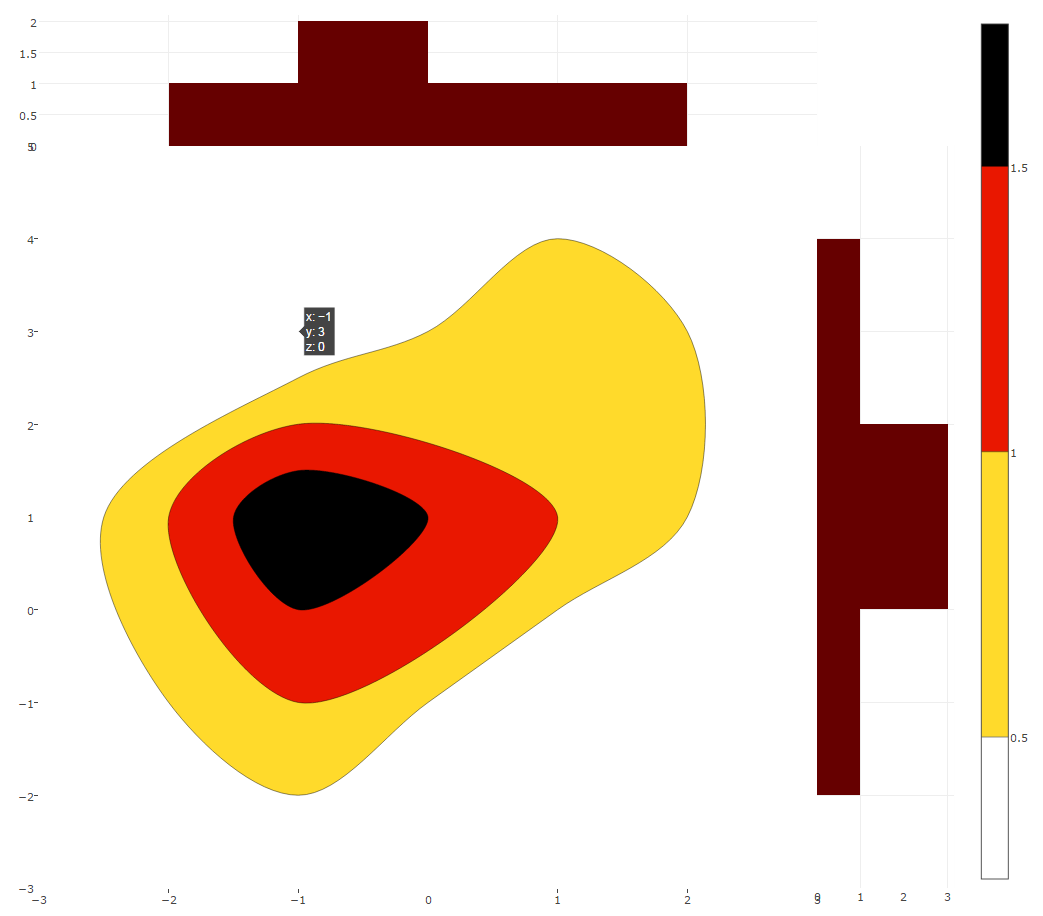
I do the Histogram2dcontour tutorial for python, and meet there very interested thing for me which I don’t understand. There is a two histogram on x/y axis’s which represent 2dCountour. I understand that they are have a same input x/y values as Histogram2dcontour, but the thing which is hidden from me is how this 2d is calculated? How this two 1-dimension histograms ‘creates’ a 2d? Could someone, please, explain in to me or share a link with me where I could found an explanation.
Thanks a lot.
P.S. - here is an example (i made it easier for me but still not understood how it works):