Hi,
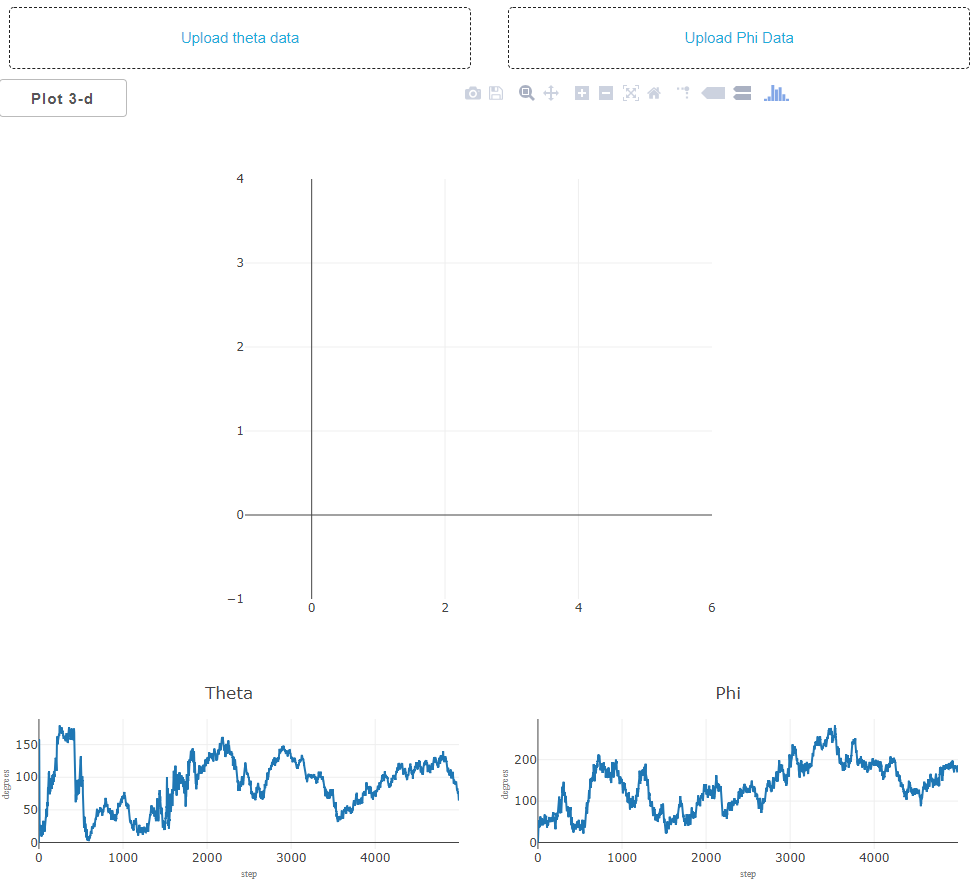
I’m writing an application where the user can upload two files, and three graphs will populate. Two of the graphs are simple line plots, but the third plot is a three dimensional sphere. My general plan is that the 3d plot should not be generated until the first two plots are generated. I’m trying to ensure this by showing a “plot 3-d” button once the other two data sources have been loaded.
Here is some simple data that the user might upload:
theta = [0.0000000e+00, 2.6586253e+00, 2.7570542e+00, 1.5821534e+00, 6.3988400e-01]
phi = [0.0000000e+00, 1.3663791e+00, 1.1650666e+00, 1.1522869e+00, 2.3086835e-01]
If I comment out the callbacks: Input(‘output-theta-upload’, ‘children’), Input(‘output-phi-upload’, ‘children’), on the third graph, the first two will plot (see generate_3d_plot() below). I have tried also adding these two inputs to the callback as States, but no luck.
However, if I leave them in, the application does not work at all. I think it has to do with the initial state trying to access data that does not exist, but I’m not sure of the way around it. Here is the console error I’m seeing:

Here is my code. I’ve pieced most of this together from the user guide and other topics in this forum.
import base64
import datetime
import io

import dash
from dash.dependencies import Input, Output, Event, State
import dash_core_components as dcc
import dash_html_components as html
import dash_table_experiments as dt
import plotly.graph_objs as go

import pandas as pd
import json
from textwrap import dedent as d

import numpy as np


app=dash.Dash()
app.scripts.config.serve_locally=True

server=app.server

app.layout=html.Div([
# Plot the line charts
html.Div([
    html.Div([
        html.Div([
            # Uploaded thetha data
            dcc.Upload(
                id='upload-theta',
                children=html.Div([
                    html.A('Upload theta data')
                ]),
                style={
                    'width': '100%',
                    'height': '60px',
                    'lineHeight': '60px',
                    'borderWidth': '1px',
                    'borderStyle': 'dashed',
                    'borderRadius': '5px',
                    'textAlign': 'center',
                    'margin': '10px'
                },
                # Allow multiple files to be uploaded
                multiple=False
            ),
            # Div that will store the data
            html.Div(id='output-theta-upload', style={'display': 'none'}),

            # Div that will store the range
            html.Div(id='output-theta-selected-range', style={'display': 'none'}),

        ],className='six columns'),

        html.Div([
            dcc.Upload(
                id='upload-phi',
                children=html.Div([
                    html.A('Upload Phi Data')
                ]),
                style={
                    'width': '100%',
                    'height': '60px',
                    'lineHeight': '60px',
                    'borderWidth': '1px',
                    'borderStyle': 'dashed',
                    'borderRadius': '5px',
                    'textAlign': 'center',
                    'margin': '10px'
                },
                # Allow multiple files to be uploaded
                multiple=False
            ),
            # Div that will store the data
            html.Div(id='output-phi-upload', style={'display': 'none'}),

            # Div that will store the selected range
            html.Div(id='output-phi-selected-range', style={'display': 'none'}),

        ],className='six columns'),
    ],className='row'),
], className='container'),

html.Div([
    html.Div([
            html.Button(
                'Plot 3-d',
                className='two columns',
                id='button-click-3d',
                style={'display': 'none'},
                n_clicks=0
            ),
            dcc.Graph(id='plot-3d-sphere', style={'height': 600},className='eight columns')
    ],className='row')
],className='container'),

#Phi and Theta Graphs
html.Div([
    html.Div([
        html.Div([
            dcc.Graph(id='plot-theta', style={'height': 200})
        ],className='six columns'),
        html.Div([
            dcc.Graph(id='plot-phi', style={'height': 200})
        ],className='six columns')
    ],className='columns')
],className='container')
])

def sphr_to_cart(phi,theta, r=1, units='radians'):
    """
    Convert Spherical to Cartesian coordinates

    :phi:       angle phi in Spherical coordinates
    :theta:     angle theta in Spherical coordinates
    :units:     'radians' or 'degrees'
    """

    assert units in ['radians','degrees'], "units must be one of ['radians','degrees']"

    if units == 'degrees':
        phi=np.deg2rad(phi)
        theta=np.deg2rad(theta)

    # Cartesian coordinates
    x=r * np.sin(phi) * np.cos(theta)
    y=r * np.sin(phi) * np.sin(theta)
    z=r * np.cos(phi)

    return x,y,z

def parse_contents(contents, filename, date, header):
    print(filename)
    content_type, content_string=contents.split(',')
    decoded=base64.b64decode(content_string)
    try:
        if 'csv' in filename or 'txt' in filename:
            # Assume that the user uploaded a CSV file
            df=pd.read_csv(
                io.StringIO(decoded.decode('utf-8')),
                header=None,
                names=[header]
            )
        elif 'xls' in filename:
            # Assume that the user uploaded an excel file
            df=pd.read_excel(io.BytesIO(decoded))
    except Exception as e:
        print(e)
        return html.Div([
            'There was an error processing this file.'
        ])

    return df.to_json()

# Parse the uploaded theta data, store in div
@app.callback(Output('output-theta-upload', 'children'),
          [Input('upload-theta', 'contents'),
           Input('upload-theta', 'filename'),
           Input('upload-theta', 'last_modified')])
def update_output_theta(list_of_contents, list_of_names, list_of_dates):
    if list_of_contents is not None:
        children=parse_contents(list_of_contents, list_of_names, list_of_dates,'theta')
        return children
    else:
        return None

# parse the uploaded phi data, stor ein div
@app.callback(Output('output-phi-upload', 'children'),
          [Input('upload-phi', 'contents'),
           Input('upload-phi', 'filename'),
           Input('upload-phi', 'last_modified')])
def update_output_phi(list_of_contents, list_of_names, list_of_dates):
    if list_of_contents is not None:
        children=parse_contents(list_of_contents, list_of_names, list_of_dates,'phi')
        return children
    else:
        return None

# generate the theta figure
@app.callback(
    Output('plot-theta', 'figure'),
    [Input('output-theta-upload', 'children')]
)
def plot_theta(data):
    df=np.rad2deg(pd.read_json(data).sort_index(axis =0))

    figure=go.Figure(
        dict(
            data=[
                    go.Scatter(
                        x=df.index.values,
                        y=df['theta'].values,
                        name='Theta',
                    )
                ],
            layout=go.Layout(
                title='Theta',
                margin=go.Margin(l=40, r=0, t=40, b=30),
                xaxis=dict(
                    title='step',
                    titlefont=dict(
                        family='Times',
                        size=10,
                        color='#7f7f7f'
                    )
                ),
                yaxis=dict(
                    title='degrees',
                    titlefont=dict(
                        family='Times',
                        size=10,
                        color='#7f7f7f'
                    )
                )
            )

        )
    )
return figure

# generate the phi data
@app.callback(
    Output('plot-phi', 'figure'),
    [Input('output-phi-upload', 'children')]
)
def plot_phi(data):
    df=np.rad2deg(pd.read_json(data).sort_index(axis =0))

    figure=go.Figure(
        dict(
            data=[
                    go.Scatter(
                        x=df.index.values,
                        y=df['phi'].values,
                        name='Phi',
                    )
                ],
            layout=go.Layout(
                title='Phi',
                margin=go.Margin(l=40, r=0, t=40, b=30),
                xaxis=dict(
                    title='step',
                    titlefont=dict(
                        family='Times',
                        size=10,
                        color='#7f7f7f'
                    )
                ),
                yaxis=dict(
                    title='degrees',
                    titlefont=dict(
                        family='Times',
                        size=10,
                        color='#7f7f7f'
                    )
                )
            )
        )
    )
return figure

@app.callback(
    Output('plot-3d-sphere', 'figure'),
    [Input('button-click-3d','n_clicks'),
     Input('output-theta-upload', 'children'),
     Input('output-phi-upload', 'children')],
)
def generate_3d_plot(n_clicks,theta,phi):


    # Unit sphere for plotting,
    u, v=np.mgrid[0:2*np.pi:0.001*np.pi, 0:np.pi:0.001*np.pi]
    XS=np.cos(u)*np.sin(v)
    YS=np.sin(u)*np.sin(v)
    ZS=np.cos(v)

    if n_clicks > 0:

        # parse the data
        theta=pd.read_json(theta)
        phi=pd.read_json(phi)

        x,y,z=sphr_to_cart(phi, theta)
        color=np.arange(len(x))

        scatter=dict(
            type='scatter3d',
            x=x,
            y=y,
            z=z,
            mode='markers+lines',
            marker=dict(
                size=4,
                color=np.arange(100),
                colorscale='Viridis',
                colorbar=dict(title='Step Number')
            ),
            line=dict(
                color='rgb(0,0,0)',
                width=2
            ),
        )

        color=np.nan

        scatter=dict(
            type='scatter3d',
            x=x,
            y=y,
            z=z,
            mode='markers+lines',
            marker=dict(
                size=4,
                color=np.arange(100),
                colorscale='Viridis',
                colorbar=dict(title='Step Number')
            ),
            line=dict(
                color='rgb(0,0,0)',
                width=2
            ),
        )

        sphere=go.Surface(
                    x=XS,
                    y=YS,
                    z=ZS,
                    surfacecolor=np.zeros(XS.shape),
                    colorscale=[[0, 'rgb(255, 255, 255)'], [1, 'rgb(255, 255, 255)']],
                    opacity=0.3,
                    visible=True,
                    showscale=False
                )

        # Set the layout
        noaxis=dict(showbackground=False,
                      showgrid=False,
                      showline=True,
                      showticklabels=True,
                      ticks='',
                      title='',
                      zeroline=False)

        layout3d=go.Layout(title='Brownian Motion on Unit Sphere',
                        font=dict(family='Balto', size=14),
                        # scene=dict(xaxis=noaxis.update(title='X'),
                        #            yaxis=noaxis.update(title='Y'),
                        #            zaxis=noaxis.update(title='Z'),
                        #            aspectratio=dict(x=1,
                        #                             y=1,
                        #                             z=1),
                        #            camera=dict(
                        #                eye=dict(
                        #                    x=1.15,
                        #                    y=1.15,
                        #                    z=1.15
                        #                ),
                        #            )
                        #            ),

                        )

        fig=go.Figure(dict(data=[sphere], layout=layout3d))
    return fig

# Display 3d plot button when theta and phi are uploaded
@app.callback(
    Output('button-click-3d', 'style'),
    [Input('output-theta-upload', 'children'),
     Input('output-phi-upload', 'children')]
)
def display_button(theta,phi):
    try:
        theta=pd.read_json(theta)
        phi=pd.read_json(phi)

        if len(theta) > 0 and len(phi) > 0:
            return {'display': 'inline'}
    except:
        return {'display': 'none'}

external_css=[
    "https://cdnjs.cloudflare.com/ajax/libs/skeleton/2.0.4/skeleton.min.css",
    "https://cdnjs.cloudflare.com/ajax/libs/normalize/8.0.0/normalize.min.css",
    "https://codepen.io/chriddyp/pen/brPBPO.css"
]
for css in external_css:
    app.css.append_css({
        'external_url': css
    })

if __name__ == '__main__':
    app.run_server(debug=False)