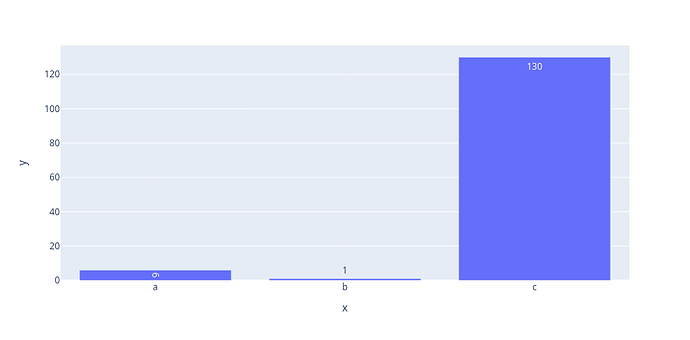
Take this code for starters, which I’m running using Plotly 5.24.1 in a Jupyter notebook in VSCode. Plotly automatically decides to draw some of the text where it fits, drawing 130 inside the bar and 1 outside the bar. The 6 however gets rotated, making it indistinguishable from a 9.
from plotly import express as px
fig = px.bar(
	y=[6, 1, 130],
	x=['a', 'b', 'c'],
	text_auto=True,
)
fig.show()
If you disable the rotation with textangle=0, it instead makes the 6 unreadably small, instead of moving it outside the bar.
from plotly import express as px
fig = px.bar(
	y=[6, 1, 130],
	x=['a', 'b', 'c'],
	text_auto=True,
)
fig.update_traces(textangle=0)
fig.show()
I can’t find any way to make it position it correctly. If you make it always draw text outside the bars with textposition='outside', it may draw some of them outside the diagram instead, so that’s not an option.
uniformtext doesn’t help either, as the only option there is to hide the 6 or make it overflow the bar.
Is there any way to get it to display this properly?


