I am struggling to adjust the layout of the tabs component for my dashboard as the data range is 11 years and the tabs overlaps when the screen size reduces. It looks like this;
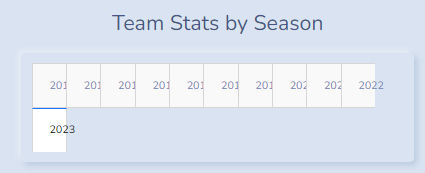
How to adjust to split half of the tabs to the 2nd row instead of just the last?
This is the code for generate the tabs component:
    html.Div([
        html.H2('Team Stats by Season', className='text-center pb-3'),
        dcc.Tabs(id='bar-chart-year-tabs', value=f'year-{max_year}', className='nav nav-pills', children=[
            dcc.Tab(label=str(year), value=f'year-{year}', className='nav-item') for year in range(min_year, max_year + 1)
        ]),
        html.Div([
            dcc.Graph(id='team-bar-chart'),
            dcc.Dropdown(
                id='team-stat-dropdown',
                options=[{'label': format_stat_name(stat), 'value': stat} for stat in team_stats],
                value='total_yards',
                className='btn w-50 mb-3')
        ], className='p-3')
    ], className='col-12 col-xl-6 px-3')
