I am trying to build a gantt chart with a table attached to it that creates a single, synchronized visual. For those familiar with Jira, I am essentially trying to replicate their Timeline view:
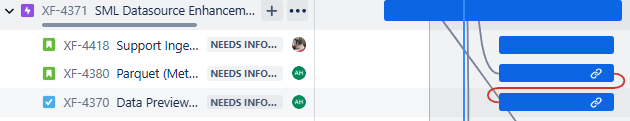
Here is a mock of the actual thing I am trying to build:

I have seen the post here Combining Table with Gantt Chart as subplot that discusses a very similar topic, but there is no requirement to have the table perfectly synchronized with the timeline visual. It is a requirement for me to have the rows map nicely to each other, where the table row spans the rows start and end times in the timeline visual. I also need the ability to display dropdown children when they are present on the row.
The functionality here is achievable in standalone with either just the table or just the timeline view, but I am finding synchronization between the two to be very difficult. Does anybody have any suggestions for how I can achieve my desired functionality here? Is there any way to utilize javascript and clientside callbacks to ensure the two are synced? Would my time be better spent creating an entire new Dash component by actually building this out in React? I am all ears for information on the best path forward. I will do what needs to be done to build this out but I’m looking for guidance on where I should turn to because this seems like a new problem that isn’t solved by Dash yet.