I am trying to compare multiple heatmaps using a Plotly figure with subplots.
I seem to have pan and zoom synchronised across all subplots but I it would be really nice to have the spikelines synchronised across all the plots as well. Try as I might I can’t get both the x axis and y axis spike lines to appear across all plots. As shown in the picture below I have the xaxis spikeline shared in a single column, and the yaxis spikeline shared in a single row
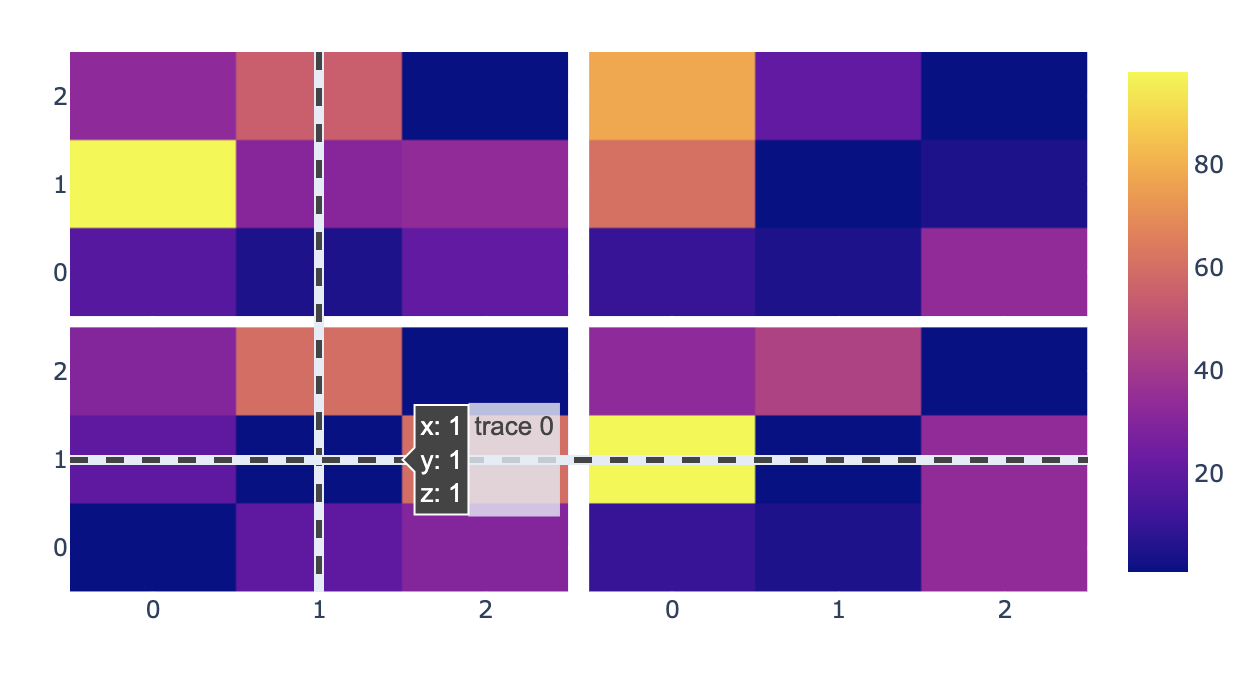
In the following picture I have drawn on the missing spikelines (in red):

Here’s the code so far:
import plotly.graph_objects as go

trace1 = go.Heatmap(
    z=[[1, 20, 30],
        [20, 1, 60],
        [30, 60, 1]],
    xaxis="x",
    yaxis="y",
    coloraxis="coloraxis"
)

trace2 = go.Heatmap(
    z=[[10, 5, 34],
        [98, 1, 34],
        [33, 44, 1]],
    xaxis="x2",
    yaxis="y",
    coloraxis="coloraxis"
)

trace3 = go.Heatmap(
    z=[[18, 5, 21],
        [98, 31, 34],
        [33, 55, 1]],
    xaxis="x",
    yaxis="y2",
    coloraxis="coloraxis"
)

trace4 = go.Heatmap(
    z=[[10, 5, 34],
        [61, 1, 5],
        [78, 21, 1]],
    xaxis="x2",
    yaxis="y2",
    coloraxis="coloraxis"
)

data = [trace1, trace2, trace3, trace4]

layout = go.Layout(
    xaxis=dict(
        domain=[0, 0.49],
        showspikes=True,
        spikemode='across',
    ),
    yaxis=dict(
        domain=[0, 0.49],
        showspikes=True,
        spikemode='across'
    ),
    xaxis2=dict(
        domain=[0.51, 1],
        showspikes=True,
        spikemode='across',
        matches='x'
    ),
    yaxis2=dict(
        domain=[0.51, 1],
        showspikes=True,
        spikemode='across',
        matches='y'
    ),
)

fig = go.Figure(data=data, layout=layout)

fig.show()
Any thoughts greatly appreciated, I’ve been scratching my head about this for a while…