Dear All,
I am using Python and Plotly for sunburst chart which has max depth of 2.
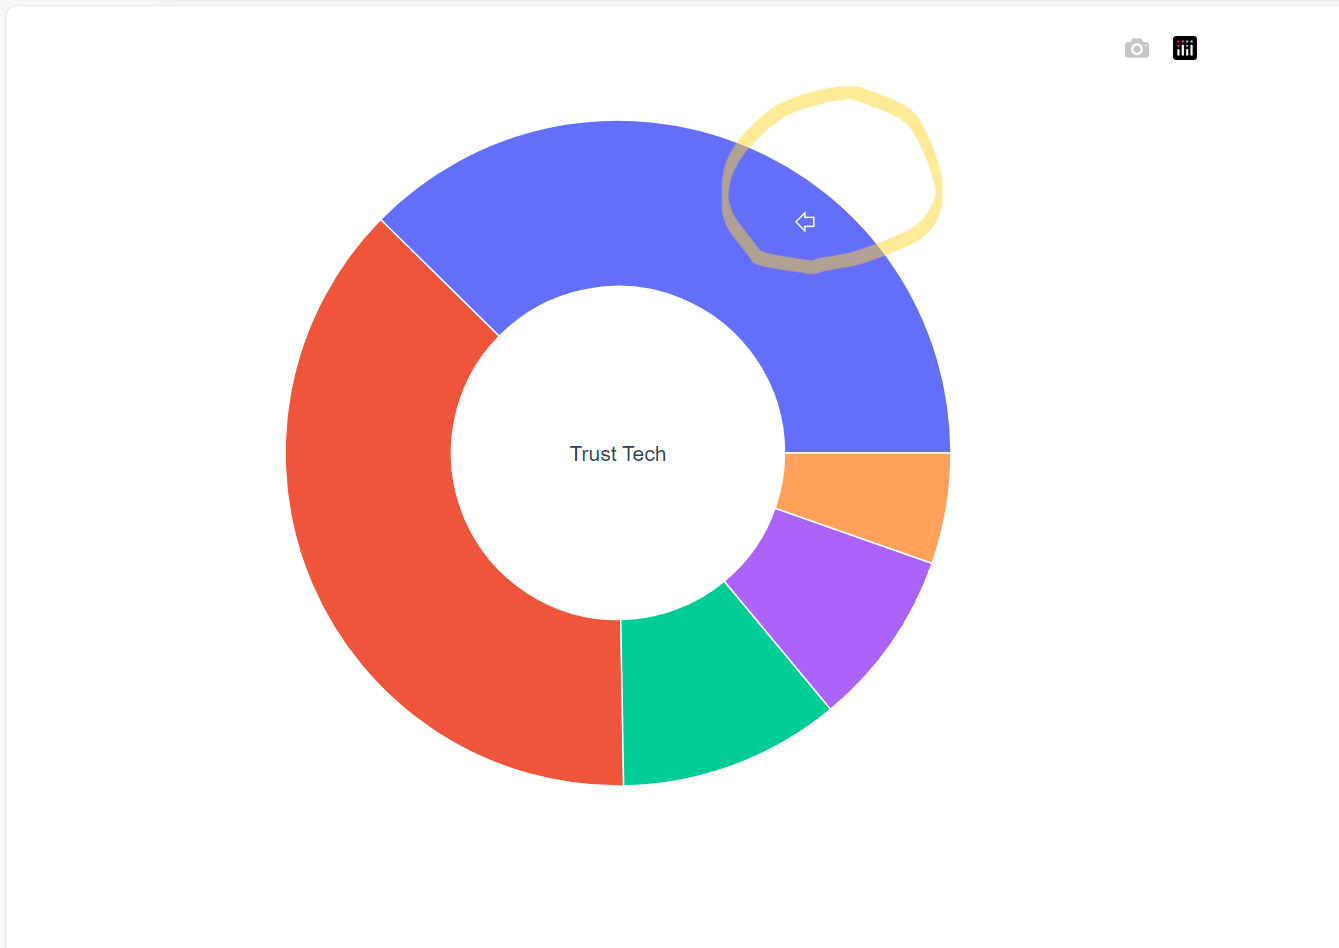
The issue I am facing is that the hover effect of layer 1 is not working while that of layer 2 is working properly.
It supports to show “Trusted Compute” in layer 1 hover.
For illustration purpose, I attached screenshots in which I hover light blue section in layer 1 and nothing appear; however, if I go into layer 2 of that blue section and hover to each item, it can display name in this case like Test 17.
I don’t want to include any text in layer 1 because text orientation is very difficult to adjust such as some text appears vertically while others displayed as horizontally.
So, I kindly request you guys for help and advice.
I attached the 2 screenshots and source code.
#Source Code
import pandas as pd
import plotly.express as px
import math
Load your CSV data (replace with your data path)
data_path = ‘sunburst_data.csv’
data = pd.read_csv(data_path)
Prepare the data
sunburst_data = data[[‘root’, ‘researchInterests’, ‘people’]]
Create the sunburst chart
fig = px.sunburst(
sunburst_data,
path=[‘root’, ‘researchInterests’, ‘people’],
maxdepth=2
)
Remove hover effect
fig.update_traces(hovertemplate=None)
Remove hover effects (use the method that works for you)
fig.update_traces(hovertemplate=‘%{label}’)
Adjust other text properties
fig.update_traces(textfont_family=“Arial”, textfont_size=14)
Function to selectively hide labels
def hide_selected_labels(fig, labels_to_hide):
for i, trace in enumerate(fig.data):
trace.labels = [“” if label in labels_to_hide else label for label in trace.labels]
Labels you want to remove
labels_to_remove = [“Trusted Analysis”, “Trusted Accreditation”, “Trusted Compute”, “Trusted Digital ID and Web 3.0”, “Others”]
Apply the label hiding function
hide_selected_labels(fig, labels_to_remove)
Save the sunburst chart as an HTML file
fig.write_html(“sunburst_chart_realdata.html”)