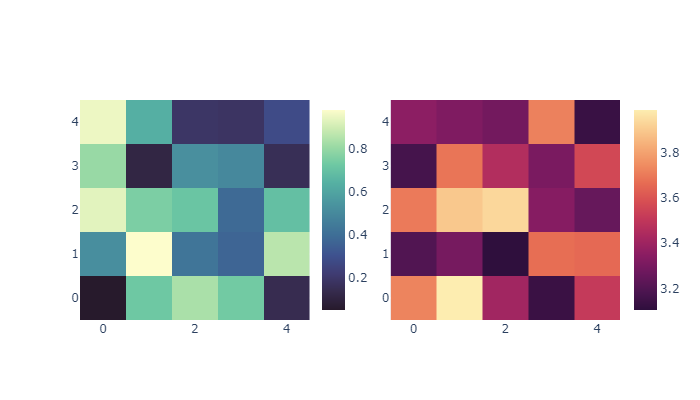
I made one figure with two subplots of heatmaps with Go.Heatmap.
Everything looks like it should do, however, some text from the colourbar (which the two plots share), sometimes seem to overlap each other. It’s not with all numbers, but always with one or two of them.
Hi @Bee, probably your two subplots have each a colorbar, and the two overlap indeed. You can use a common coloraxis instead as described in this example.
Unfortunately I have two plots which have significant different values. The range of the first plot is between 200-300 whereas the second one is between 4-5. Using a common color axis will lead to having only two colors in both plots, which is not what I try to achieve. The colourbar which I showed before is actually exactly what I want, unfortunately the text is overlapping.
I will try to make two bars instead. I did it with giving the parameters x, y, and len for colorbar to decide the position of both separate colourbars. Thank you for your help.
I am trying to make a sequence of heatmaps controlled by a slider, so far so good. But I notice that once you assign the axis with coloraxis='coloraxis1 (so that all the heatmaps are having the same colorscale), then you can no longer use colorbar_x or colorbar_y to move it around. Would you please help me verify if this is accurate? And may I know how to move colorbar around under this situation? Thank you very much!
I have the same issue as described above. The described soution works fine for heatmap subplots in horizontal arrangement.
However, I want to arrange the heatmap subplots vertically below each other with their own colorbars on the right. I tried to use the colorbar_y parameter to arrange the colorbars below each other. The colorbars can be positioned below each other, but they still overlap due to their length. Is there a way to determine the size of the colorbar? I.e. to shorten the colorbars?
I only found a parameter for the bar thickness, none for the size. Thanks