I am charting a subplot graph of several traces, based on both categorical and continuous features, basically a very large grid of bar charts. (in this case, 4 x 83). Many of the categorical features are ordinal; ie, one of [1, 2, 3, 4]; however, I would like to examine them as categorical.
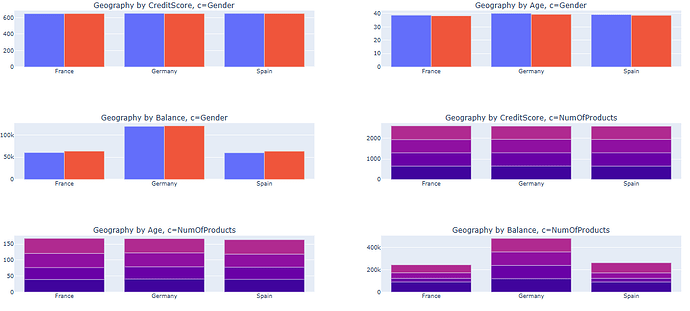
The problem is that automatically changes the barmode to “stacked” when it sees a numerical variable, like this:
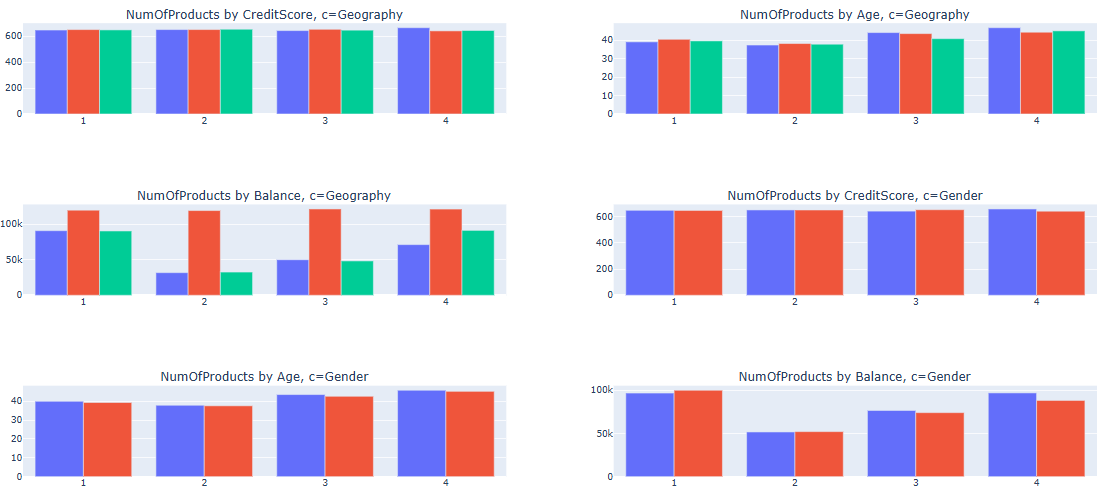
When I would like to view as barmode=“group”, so they all appear like this:
Does anyone have any idea how to “force” the barmode to be group?

