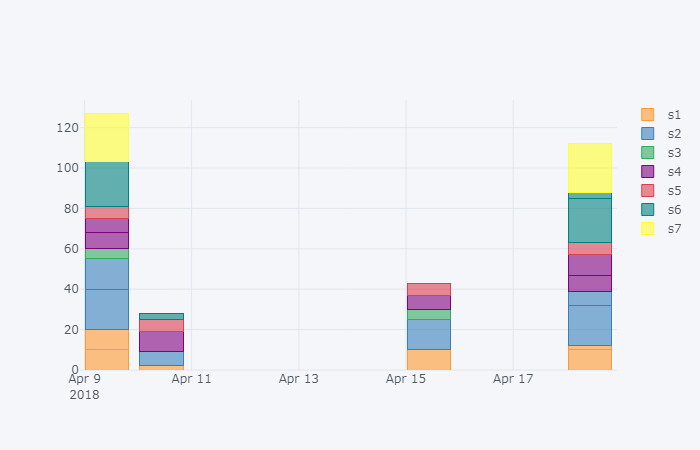
While plotting stacked bar graphs, bars with very close x-axis values are getting combined.
How to disable the bars from getting combined? [Plot attatched]
My Code:
import pandas as pd
import cufflinks as cf
import plotly
plotly.offline.init_notebook_mode()
all_data = [
(‘2018-04-09’, ‘10:10:11’, [‘s4’,8], [‘s2’,20],[‘s1’,10],[‘s6’,22],[‘s7’,24]),
(‘2018-04-09’, ‘10:10:12’, [‘s1’,10],[‘s2’,15],[‘s3’,5],[‘s4’,7],[‘s5’,6]),
(‘2018-04-10’, ‘10:30:11’, [‘s4’,10],[‘s5’,6], [‘s6’,3],[‘s1’,2],[‘s2’,7]),
(‘2018-04-15’, ‘10:18:11’, [‘s1’,10],[‘s2’,15],[‘s3’,5],[‘s4’,7],[‘s5’,6]),
(‘2018-04-18’, ‘10:20:11’, [‘s4’,8], [‘s2’,20],[‘s1’,10],[‘s6’,22],[‘s7’,24]),
(‘2018-04-18’, ‘10:20:12’, [‘s4’,10],[‘s5’,6], [‘s6’,3],[‘s1’,2],[‘s2’,7])
]
df = pd.DataFrame(all_data, columns = list(“ABCDEFG”))
df[“day/time”] = pd.to_datetime(df[“A”] + " " + df[“B”])
df = df.melt(id_vars = [“day/time”], value_vars = [“C”, “D”, “E”,“F”,“G”])
df[[“category”, “val”]] = pd.DataFrame(df.value.values.tolist(), index = df.index)
df = df.pivot(index = “day/time”, columns = “category”, values = “val”)
fig = df.iplot(kind=‘bar’, barmode=‘stack’, asFigure=True)
plotly.offline.plot(fig,filename=“top1.html”)
In the first bar below bars of ‘2018-04-09’, ‘10:10:11’ & ‘2018-04-09’, ‘10:10:12’
