Hi @fk4517,
To get the curve of intersection we need a bit of math. First the cutting plane is defined by a point M(x0, y0, 0), and two directions contained in this plane: v=[a, b, 0], w=[0, 0, 1]. We get the plane equation from the determinant:
The equation of the surface is of the form z=f(x, y), and depending on the position of the plane (i.e. the direction of the vector v) the curve equation can be of the form: y =f(x, y0), y= f(x0, x) or y= f(x, h(x)). That’s why we gie code for a function which performs each function composition.
import numpy as np
import plotly.graph_objects as go
from plotly.subplots import make_subplots
def compose1(f, c):
# compose a function of two variable with the constant function phi(x)=c: f(phi(x), y)
g = lambda y: f(c, y)
return g
def compose2 (f, c):
# compose a function of two variable with the constant function phi(x)=c: f(x, phi(x))
g = lambda x: f(x, c)
return g
def composefh(f, h):
# compose the function f(x,y) with y=h(x):
g = lambda x: f(x, h(x))
return g
def get_curve(M, v, f):
# M a 3-list or array- represents a point in the plane of intersection: M=[x0, y0, 0]
# v= [a, b, 0] direction contained in the plane along with w=[0,0,1]
# f function of two variables that define the equation of the surfae z=f(x,y)
# returns the function g that defines the equation y=g(x) of the curve of intersection
x0, y0, _ =M
a, b, _ = v
if a == 0 and b != 0:
g = compose1(f, x0)
id =1
elif a != 0 and b==0:
g =compose2(f, y0)
id=2
else:
h = lambda x: y0+b*(x-x0)/a
g = composefh(f, h)
id=3
return g, id
# Function that returns the X, Y, Z-array defining the section plane as a Plotly surface
def get_plane(M, v, id, xx, yy, zz):
# M point contained by the plane
# v direction included in plane (orthogonal to w=[0, 0, 1])
# id - is the id returned by the function get_curve; the plane arrays, X, Y, Z, are defined according to id value
x0, y0, _= M
a, b, _= v
if id == 1:
Y, Z = np.meshgrid(yy, zz)
X = x0*np.ones(Y.shape)
elif id == 2 :
X, Z = np.meshgrid(xx, zz)
Y = y0*np.ones(X.shape)
elif id == 3 :
X, Z = np.meshgrid(xx, zz)
Y = y0+b*(X-x0)/a
else:
pass
return X, Y, Z
# Define the surface to be cut by a plane:
f_surf = lambda x, y: (x+y)/(2+np.cos(x)*np.sin(y))
# and data to instantiate the Plotly Surface:
xx = np.linspace(-2, 5, 200)
yy = np.linspace(0, 10, 300)
x,y = np.meshgrid(xx, yy)
z = f_surf(x, y)
zz = np.linspace(z.min(), z.max(), 100)
# define the elements to get the section plane equation
M = [1, 2, 0] # a point in the plane
v = [1, 2, 0] # a direction contained in the plane
g, id = get_curve(M, v, f_surf)
X, Y, Z = get_plane(M, v, id, xx, yy, zz)
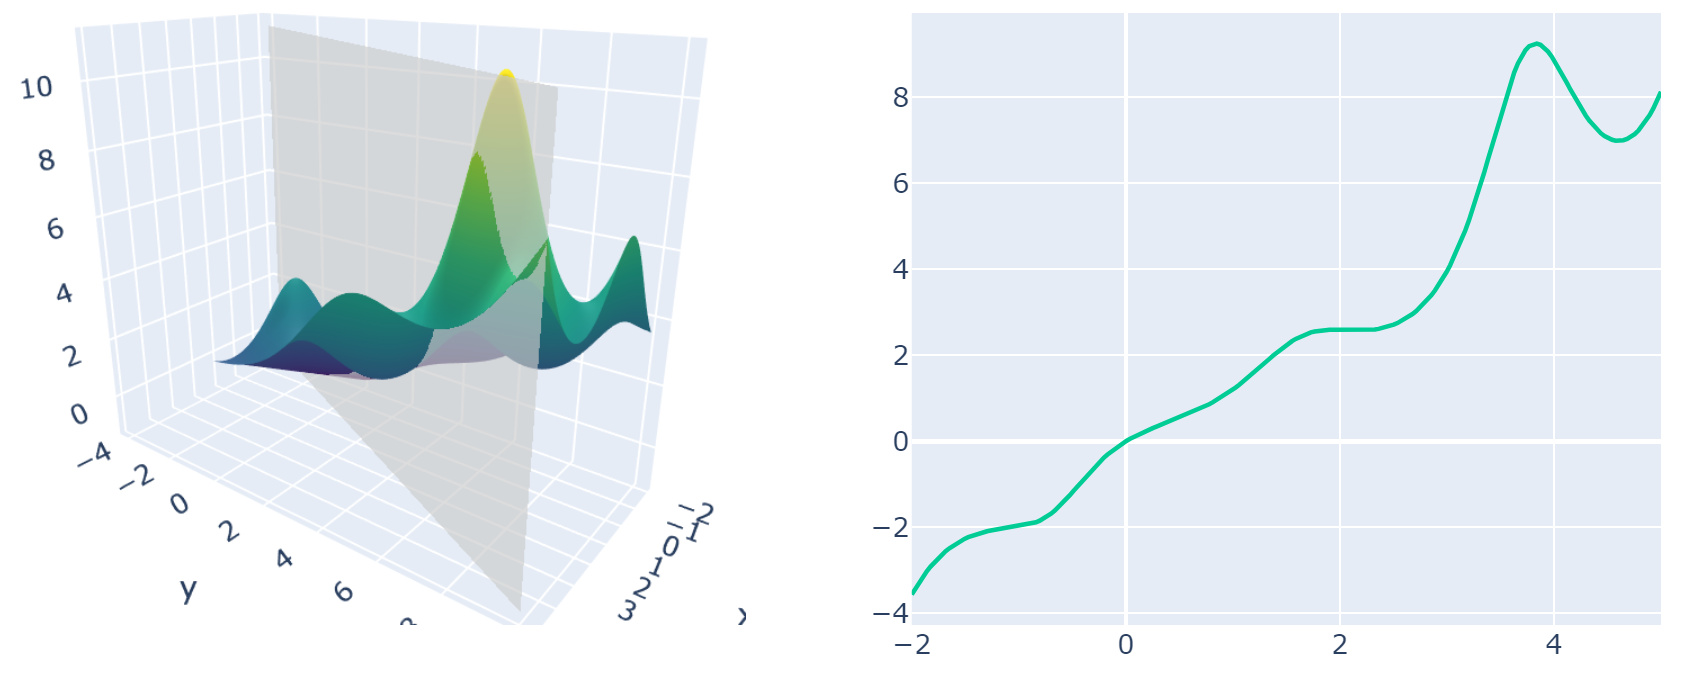
#Define subplots of 1 row and two columns. In the subplot (1,1) draw the surface of equation z=f(x,y) and the cutting plane
#perpendicular on the plane z=0, while in (1,2) the resulted curve.
fig = make_subplots(
rows=1, cols=2,
horizontal_spacing=0.1,
specs=[[{"type": "scene"}, {"type": "xy"}]])
fig.add_trace(go.Surface(x=x,
y=y,
z=z,
colorscale="Viridis",
showscale=False), row=1, col=1)
fig.add_trace(go.Surface(x=X, y=Y, z=Z,
colorscale= [[0, "rgb(254, 254, 254)"],
[1, "rgb(254, 254, 254)"]],
showscale=False,
opacity =0.65), row=1, col=1)
fig.add_trace(go.Scatter(x= xx, y = g(xx), mode="lines"), row=1, col=2)
fig.update_layout(title_text="Slicing a surface by a plane",
title_x=0.5,
scene= {"camera": {"eye": {"x": 1.65, "z":0.75}}},
width=900, height=500, yaxis = {"domain": [0, 0.85]}
)
Here is the same example with a dropdown menu to select the plane position:
https://chart-studio.plotly.com/~empet/15693/#/