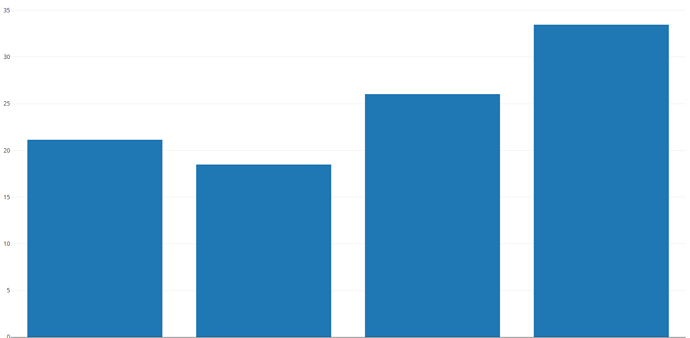
Good day everyone, I’m trying to show the y-values of different categories as text instead of hover data in the go.Bar() and go.Layout component, while I found it a little bit confusing.
Is there anyway I could achieve my goal like below please?
current in dash:
target:

