Dash Distribution Explorer
Bayesian Inference has recently picked my interest. As I started working though this book, I realized it is important to update my knowledge on different probability distributions. I’m always confused about different distribution, what they look like, and when to use them. So, to help me out, I develop an application where I can explore them.
The repository is not fully complete in terms of the distributions in intend to implement, but it is feature complete.
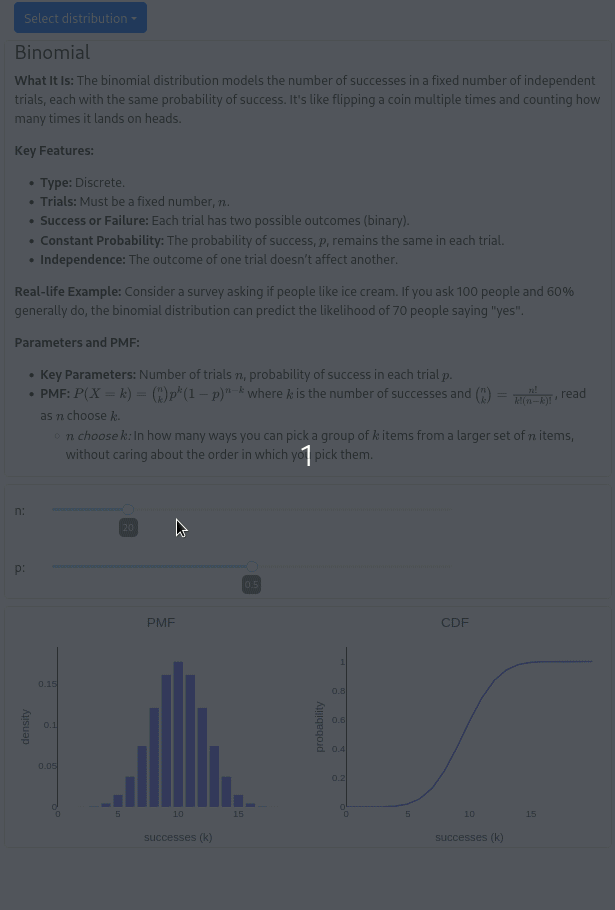
Demo
Adding more
The application is easily extendible. In dist is where I define the probability functions, parameters (and their allowable range), and figures.
Each distribution needs to have a description in markdown, parameters, and it probability function (see scipy.stats). The parameter dicts are used to create the slider, so they must have parameters that the dcc.Slider() components requires and accepts.
Example:
class Binomial(Distribution):
    def __init__(self):
        self.description = markdown_description
        self.fn = binom
        self.parameters = dict(
            n=dict(
                min=1,
                max=100,
                value=20,
                step=1,
                type='integer',
            ),
            p=dict(
                min=0.0,
                max=1.0,
                value=0.5,
                step=0.01,
                type='float'
            )
        )
In addition, the methods defined in the base class, located in ./dist/base.py must be implemented.
When that is done, simply import the model in constants.py in the root directory, s follows:
from dist import Distribution, Binomial, Poisson
from typing import Dict

# Define name
BINOM = 'Binomial'
POISSON = 'Poisson'

# Store in list
DIST_NAMES = [
    BINOM,
    POISSON,
    # 'Geometric',
    # 'Negative Binomial',
    # 'Normal',
    # 'Uniform',
    # 'Exponential',
    # 'Beta',
    # 'Gamma',
]
DIST_NAMES.sort()

# Set an initial distribution on page load
INITIAL_DISTRIBUTION: str = BINOM

# Create a mapping from and id to name, and vice versa
D2I: Dict[str, int] = {d: i for i, d in enumerate(DIST_NAMES)}
I2D: Dict[int, str] = {i: d for d, i in D2I.items()}

# Actual reference to the model
DISTNAME2DIST: Dict[str, Distribution] = {
    BINOM: Binomial(),
    POISSON: Poisson(),
}
Example implementation of a model can be found here.
All interactions are dynamically generated. For instance, if you fish to construct more figures, you can simply implement more functions that return figures. They will be dynamically added.
Note
This is a work in progress, but it is feature complete. Hence, I share the current project. I include this project in a personal multi-page dash app, which not available to the public. However, I can imagine its useful to others.