Thank @AnnMarieW.
May I ask you on which browser did you get the screen shots? The horizontal scrollbars should have hidden ![]()
Thank @AnnMarieW.
May I ask you on which browser did you get the screen shots? The horizontal scrollbars should have hidden ![]()
Hi @Berbere
Scroll bars look about the same on Chrome and Firefox when the browser is not full screen.
Scrollbars are an automatic thing, you can look up different styling options using things like WebKit, etc.
Nice app @the.oldest.house! It would be cool (figuratively and literally), if we can somehow combine urban tree cover / heat island with places available to buy / rent. Just an idea. Happy to extract the data for you for LA.
An impressive app indeed. Thanks for working on this and submitting it @the.oldest.house . What do you think of @masands’s idea to combine it with tree cover?
@cosco Thank you for submitting your app.
Are you able to create a demo account (username and password) that we could use to discover your app? Not everyone is much inclined to create new accounts or share their email address.
That would be cool! Where do you get this data? I had no idea that was even possible.
Amazing app, rich with information. I also really like that it updates daily.
Thank you for submitting it, @Berbere . I am also getting a horizontal bar in the app. I’m using the Brave browser.
Hello Adam,
sure since I havent written any terms or agreements I can understand your doubt. I created a testaccount.
Email is: testuser@testuser.com
Password: 12345678
My plan is to notify my users if I release a new app or if I made more progress in my current app since I still have lots of work and rework to do (made some big mistakes). If you enjoyed the content you can still register. I can guarantee I will not abuse data.
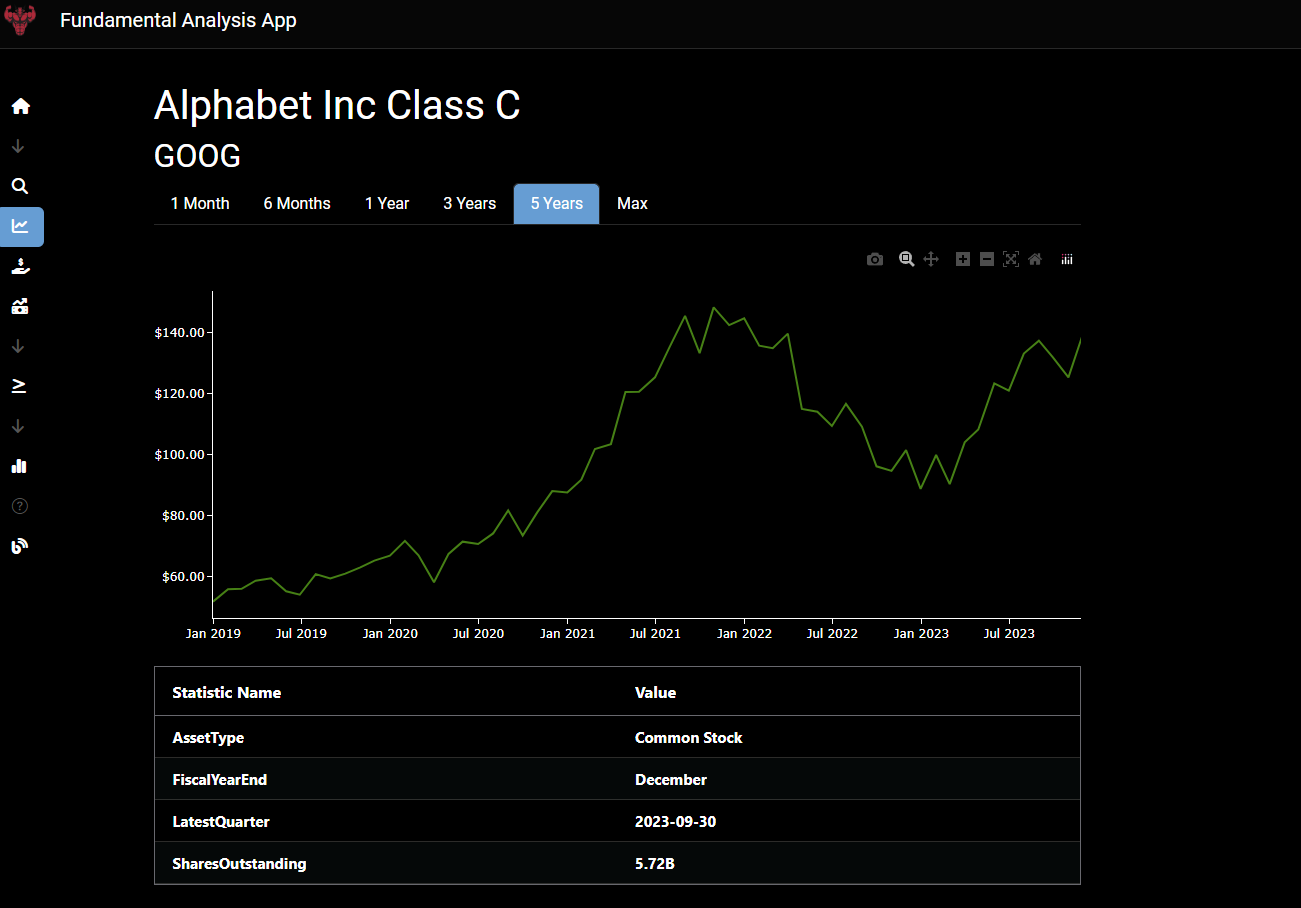
Regarding use: Just go to searchscreen and search a stock then you can check other pages.
Please be free to leave feedback. especially what you disliked.
I’ll use the Landsat 8 data to calculate the tree cover and UHI for you over LA. Just need to find a suitable statistical area boundary files for the city
Landsat 8 Datasets in Earth Engine | Earth Engine Data Catalog | Google for Developers
Edit: Actually, try this open dataset from the USDA first
Region 5 - State (usda.gov)
It looks like you put a lot of work into this app. Congrtulations, @cosco It looks good.
What’s the difference between the two compare companies tabs?
Hello Adam yes that is true and there is still a lot to do. One is for a detailed analysis of one company the other one is for comparison. I have to work this out though … There is still a lot missing, but for me it is enough to have an edge . What do you think?
I think your app has incredible potential and I honestly look forward to seeing how you develop it.
Thank you everyone for your submissions. The November submissions are officially closed. We will use the next couple of weeks to judge these apps and update this thread with a post on all the apps selected to be added to the Explore Page.
Stay tuned.
I was able to get this loaded into Dash Leaflet but the TIF only contains one zoom level. Any ideas on how I can provide the overlay for all zoom levels? I’ve tried using GDAL to generate new tiles:
here’s how i generated it:
Step 1: Convert the TIFF File to RGB/RGBA Format
docker run --rm-v ~/Los_Angeles_and_Long_Beach_and_Anaheim:/data osgeo/gdal gdal_translate -of vrt -expandrgba /data/urbancanopy2018 /Los_Angeles_and_Long_Beach_and_Anaheim_canopy2018.tif /data/urbancanopy2018/Los_Angeles_and_Long_Beach_and_Anaheim_canopy2018_rgba.vrt
Step 2: Generate Tiles from the RGB/RGBA VRT File
docker run --rm-v ~/Los_Angeles_and_Long_Beach_and_Anaheim:/data osgeo/gdal gdal2tiles.py -z 9-12 b --processes=10 /data/urbancanopy2018/Los_Angeles_and_Long_Beach_and_Anaheim_canopy2018_rgba.vrt /data/tiles_output
Step 3: Convert Tiles to MBTiles
mb-util /path/to/tiles_output /path/to/destination/urban_canopy_zoom_9_12.mbtiles
Step 4: Insert metadata
sqlite3 /path/to/urban_canopy_zoom_9_19.mbtiles
INSERT INTO metadata (name, value) VALUES ('format', 'png');
Step 4: Serve MBTiles with a Tile Server
docker run --rm-it -v ~/mbtiles:/data -p 8080:8080 maptiler/tileserver-gl
In the Tileserver-GL UI I can see the canopy layer but it simply won’t show up in Dash Leaflet.
Whereas if I do a direct conversion using gdal_translate (omitting the gdal2tiles step), the layer shows up in Dash Leaflet, but only at one zoom level.
Hi
Been busy with work, I’ll take a look this weekend. You may want to aggregate the data up to the suburb level and display a filled map instead? I’m not too familiar with leaflet, I used the Plotly Mapbox filled map for my app.
Thank you everyone for submitting your Dash apps for consideration. It’s neat to see how far you’ve been able to take Dash ![]()
Over the next week we will be promoting all your apps on social media, highlighting what you’ve done with Dash.
@the.oldest.house and @Berbere : your apps will be added to the Plotly Dash Explore page early next week.
For those interested in submitting other apps, click the Share-Your-App button in the Explore page.