Hi everyone,
I’ve been using Dash for a few years now and I have to say that I love it! I want, on the one hand, to give back to the Plotly community and, on the other hand, to show the world how great Dash’s capabilities are when it comes to creating analytical web applications that help solve real business problems.
This project is, on the one hand, a fully working web application for analyzing and optimizing the cost of operating a power system and, on the other hand, an extensive tutorial in two powerful Python libraries: Dash and pyomo (numerical optimization).
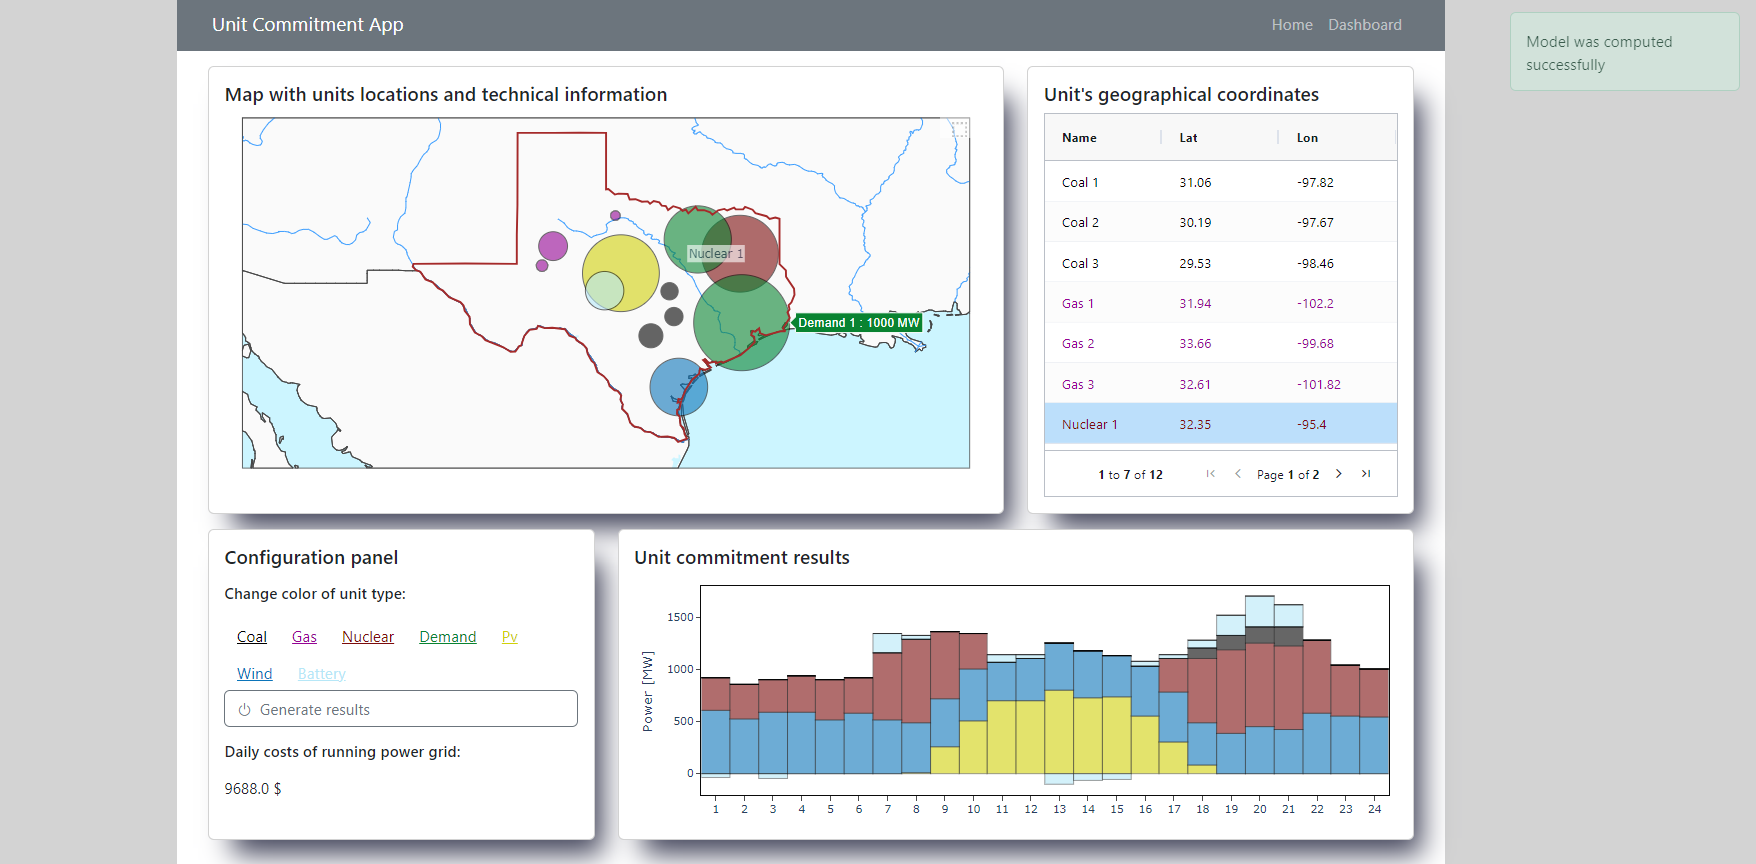
In this application, electricity production costs are minimized to provide a given daily demand profile. You can add, delete or modify (CRUD operations) the parameters of individual unit types: utility power plants (coal, gas and nuclear), battery storage, renewables (wind and photovoltaic farms) and demand sources. You can then run an optimizing model and check the (optimal) daily cost of electricity production and the energy production profile of each unit, ranked on the chart according to their variable generation costs.
As for the Dash (and pyomo) tutorial, I make it available as successive releases in the GitHub project repository. Each release is a coverage (with description) of another functionality from these libraries - in this tutorial I go from a minimal Hello World type app up to showing how to host such a fully feature app, which also uses a publicly available solver, using Docker. Hence the tutorial includes examples of using (as far as Dash is concerned):
- the most important Dash basics: initializing a simple Dash app, callbacks (input, output and state) along with chaining them, using a store, creating and styling a figure
- dash-bootstrap-components library, including: using components, themes and icons from this library and also creating a responsive grid layout
- custom styling with topography.css file
- interactive map: clicking on a given point opens a modal for editing or deleting a given point (source of supply or demand) and selecting an area opens a modal for adding a new point
- AG-Grid table with conditional formatting
- Patch Class for modificating a plot
- error handling with PreventUpdate and no_update together with immediate verification of the value entered by the user
- fading push alerts after user actions
- dash_daq library for changing application colors
- Dash Pages for creating a Multi Page App along with a custom 404 error page and navigation bar
- waitress library for deploying a Dash app
- Docker for containerizing a Dash app
Each of these functionalities make up the final version of the app, which you can pull from DockerHub project repository and run on your own machine.
I would be more than happy if the Plotly community gave me feedback on this project!