Shapes in ternary plot

I am new to python and plotly. I am trying to modify plotly ternary plots: https://plotly.com/python/ternary-plots/

I am coding in jupyter notebook (through Anaconda), I want to do two things:

  1. Add shapes as polygons inside the ternary plot. I found this article, but unsure how to apply to a chart with three axes: https://plotly.com/python/shapes/
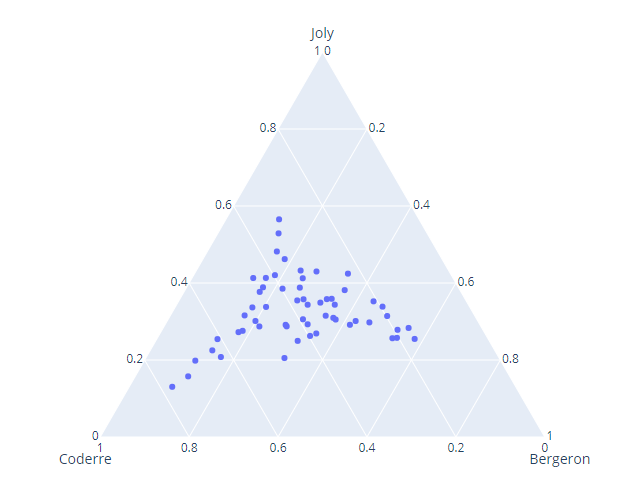
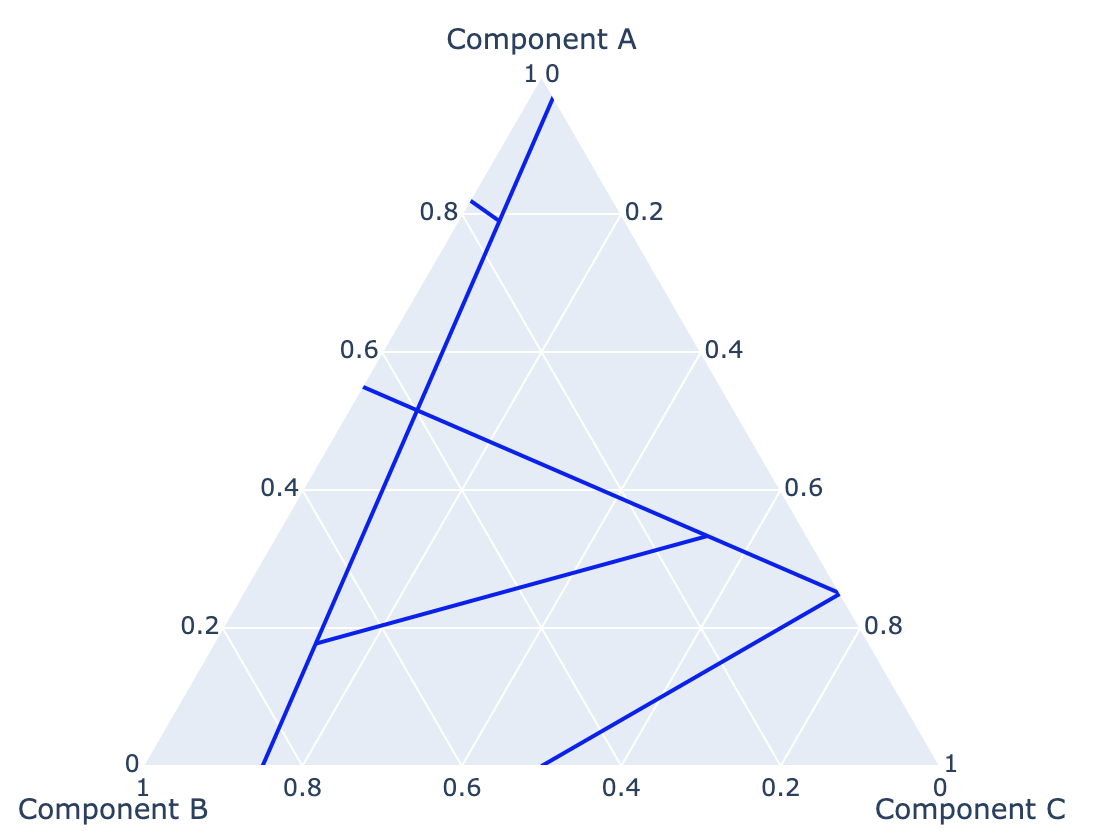
    I want to create sub fields (as polygons) within the ternary plot, similar to the image here:

  2. I want to change the grid lines to increments of 10 instead of the present 20, light white lines inside the ternary image here:
    image

Any advice would be greatly appreciated!!

Hi @klbutler88,

Welcome to Forum!!

To draw polygons like in your posted image, you donā€™t need shapes. A Scatterternary trace with mode='lines',
does the job:

fig=go.Figure(go.Scatterternary(a= [0.45,  0.6, 0, 0.8, None,0.33,0],
                                b= [0.55, 0, 0.3, 0.2,None, 0,0.62],
                                c= [0, 0.4, 0.7, 0, None,0.67, 0.38], mode='lines',
                                line_width=2, line_color='#0000ee'))

Thank you @empet!! If I make lines as you have demonstrated - how can I also plot data as symbols as in the first images I posted (data = dataset QtFL as blue crosses). Is there a way to save the lines as a template or background and then plot data from my csv file on top? Thanks sincerely!!

@klbutler88

For your data define a second Sccatterternary trace, mode='markers', marked with crosses.

trace1 = go.Scatterternary(a= [0.45,  0.6, 0, 0.8, None,0.33,0],
                           b= [0.55, 0, 0.3, 0.2,None, 0,0.62],
                           c= [0, 0.4, 0.7, 0, None,0.67, 0.38], mode='lines',
                           line_width=2, line_color='#0000ee')

trace2 = go.Scatterternary(a=[...], b=[...],c=[...] , mode='markers', marker_symbol='cross', marker_color='red')

fig=go.Figure(data=[trace1 trace2])
1 Like

@empet wohoo!! Thanks so much!!

Any idea how to fill between the lines with different colors?

Also, any idea how to change the gridlines from every 0.2 to every 0.1?

Thanks sincerely!!

Hi @klbutler88,

To fill in a polygon just pass the a, b,c coordinates of its vertices to a go.Scatternary constructor, as follows:

fig=go.Figure(go.Scatterternary(a= [0.33,  0.6, 0, 0.33],
                                b= [0.33, 0, 0.3, 0.33],
                                c= [1-0.66, 0.4, 0.7, 1-0.66], 
                                mode='lines',
                                line_color='black', #or 'orange' #or a color code
                                line_width=0.5,
                                fill='toself',
                                fillcolor='orange'     #'#0000ff',
                                ))

Hence fill='toself' defines a ternary shape from a closed polygon. The shape is generated even if you do not repeat the first coordinates at the end of coordinate lists, but in this case the surrounding boundary line is incomplete. Just check it!

@empet excellent!! I think final question :slight_smile:

For defining my data in the second trace (trace2) can I call a CSV file instead of directly entering the data?

I tried:
df=pd.read_csv(ā€˜filename.csvā€™)
trace2 = go.Scatterternary(df, a=ā€˜acolumnā€™, b=ā€˜bcolumnā€™,c=ā€˜ccolumnā€™ , mode=ā€˜markersā€™, marker_symbol=ā€˜crossā€™, marker_color=ā€˜redā€™)

with a,b,c being columns from the CSV file. This does not work. I get an error:
ValueError: The first argument to the plotly.graph_objs.Scatterternary
constructor must be a dict or
an instance of :class:plotly.graph_objs.Scatterternary

I think I figured out a reasonable way to do what I was asking about above:

df=pd.read_csv(ā€˜SSpetro_Ternary_exampledata.csvā€™)
a1 = df[ā€˜Qtotalā€™] #columns from .csv file above
b1 = df[ā€˜Ftotalā€™]
c1 = df[ā€˜Ltotalā€™]
trace = go.Scatterternary(a=a1, b=b1,c=c1,mode=ā€˜markersā€™, marker_symbol=ā€˜crossā€™, marker_color=ā€˜redā€™)

Works!

@klbutler88,

I omitted to answer how to set the axes ticks:

fig.update_layout(ternary_aaxis_dtick=0.1, 
                  ternary_baxis_dtick=0.1, 
                  ternary_caxis_dtick=0.1)

For the last question the answer is:

df = pd.read_csv(ā€˜filename.csvā€™)
trace2 = go.Scatterternary(a=df['acolumn'], 
                           b=df['bcolumn'],
                           c=df['ccolumnā€™'], 
                           mode='markersā€™, 
                           marker_symbol='cross',
                           marker_color='red')

To get help on go.Scatterternary print in a notebook cell:
help(go.Scatterternary)

while for layout:

help(go.Layout.ternary)

When you paste sample code on forum, please format it following these rules:
https://help.github.com/en/github/writing-on-github/creating-and-highlighting-code-blocks.

1 Like

@empet you been have VERY helpful and thank you for the heads up on rules for sharing sample code on forum!

My ternary is getting to where I want it to be! A few things I couldnā€™t figure out from the help menus you recommended.

  1. Is there a way to have a different symbol for each data point (square, triangle, cross for example)? I donā€™t mind if the symbol is randomly chosen. My .csv has a column called ā€œsample_idā€ so perhaps I can write a code that assigns a symbol based on that column?

  2. Is there a way to change the axes from 0-1.0 to 0-100 ?

  3. Can text be added inside the ternary - to label the fields within the lines Iā€™ve plotted. If this is huge pain in the ass, I can just do it in Illustrator after exporting the figure. Just curious.

Thanks a million!

@klbutler88

This code illustrates how to code each of your above requirements:

a=[0.134, 0.125, 0.141, 0.172, 0.208, 0.165, 0.187, 0.153]
b= [0.4, 0.4, 0.384, 0.37, 0.351, 0.403, 0.292, 0.336]
c= [0.466, 0.475, 0.475, 0.458, 0.441, 0.432, 0.521, 0.511]

fig = go.Figure(go.Scatterternary(
                a=a,
                b=b, 
                c=c,
                mode='markers',
                name='test', 
                marker_symbol =['circle-open']*2+['triangle-up']*3+['cross']*3,
                marker_size=12, marker_color=['red']*2+['blue']*3+['green']*3)   
           )

# To insert text at some positions define an auxilliary trace:
fig.add_scatterternary(a=[0.4, 0.6], b=[0.35, 0.2], c=[0.25, 0.2],
                        mode='text', text=['text1', 'text2'])
fig.update_layout(ternary_sum=100)

@empet, sweet!

Do you know if there is a way reverse the ternary axes? Here is my current ternary, and the RED labels are my desired axes.

Hi @klbutler88,

No, you cannot reverse ternary axes. Only cartesian axes can be reversed :frowning:

2 Likes

Hi guys!

iā€™ve tried to run thius code and got the following error:

Input In [121]
fig=go.Figure(data=[trace1 trace2])
^
SyntaxError: invalid syntax

could you help me?
Thanks

Hi @ARdeB welcome to the forums.

There is a comma missing in your list.

ā†’ fig=go.Figure(data=[trace1, trace2])

Thanks @AIMPED
Now i have another problem, l canā€™t draw the lines as the ternary diagram mentioned above (QFL)