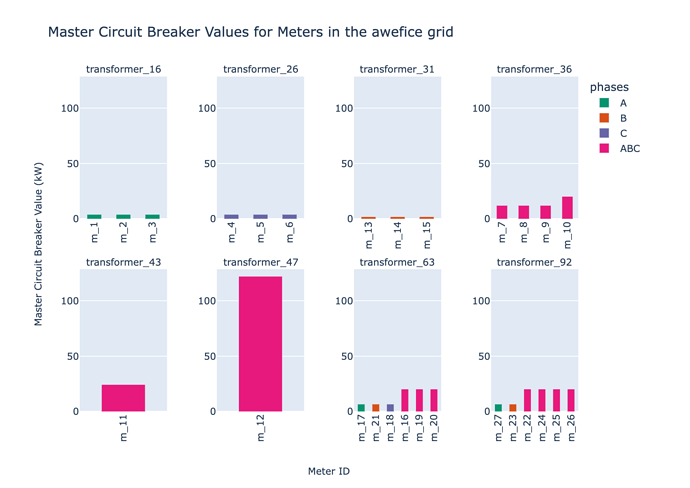
I am plotting a bar graph with facet plots. The subplots don’t have the same number of categories. I am looking for a way to set the bar width to be similar in all the subplots. Any suggestions?
Here is the code:
     fig = px.bar(df, x=x_axis, y=y_axis, title=title, labels=labels, facet_col='parent_transformer_id',
                 facet_col_wrap=4, facet_row_spacing=0.15, facet_col_spacing=0.1,
                 color='phases', category_orders = {"phases": ["A", "B", "C", "ABC"]},
                 color_discrete_sequence=px.colors.qualitative.Dark2, height=600, width=800)

    fig.update_xaxes(matches=None, showticklabels=True, visible=True)
    fig.update_xaxes(tickangle=270)
    fig.update_yaxes(showticklabels=True, visible=True)
    fig.update_traces(width=.5)

    # Update the axes' titles.
    fig.for_each_annotation(lambda a: a.update(text=a.text.split("=")[-1]))
    fig.for_each_yaxis(lambda y: y.update(title = ''))
    fig.add_annotation(x=-0.1,y=0.5, text="Master Circuit Breaker Value (kW)",
                       textangle=-90, xref="paper", yref="paper", showarrow=False)
    fig.for_each_xaxis(lambda x: x.update(title = ''))
    fig.add_annotation(x=0.5,y=-0.2, text="Meter ID", xref="paper", yref="paper", showarrow=False)
And here is the plot:
