Hello, I know this is an already solved problem but any solution is working for me.
I am generating an histogram in a callback like this:
layout = go.Layout(
        autosize=False,
        title=title,
        legend=dict(x=0, y=1.15, orientation="h")
    )

    return hg, go.Figure(data=data, layout=layout)
It updates the following graph:
histogram =  dcc.Graph(id='histogram', style={
            'width':'100%',
            'height': '370px'
        }, config={'displayModeBar': False})
That is inside a div ( whose display attribute is toggled when needed):
html.Div([html.H4('Histogram'),histogram],id='histogram_div',style = {"display": "none",'color':'black', 'width':'100%','height':'300px','margin':'0 auto'}),
If I don’t specify the layout width, what I obtain is this:
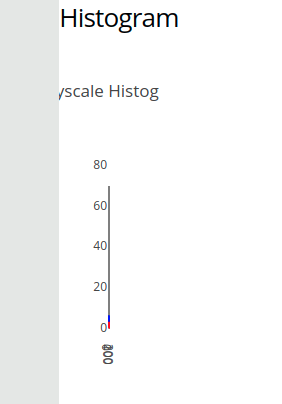
If i resize the screen, the graph is updated to the desired width:
