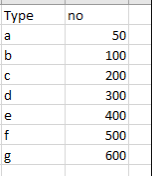
Hi everyone, I’m new to plotly, I have two different plots below (go.Pie & go.Bar) and I like to assign a color to each type (a - g) label as shown in the color_discrete_map. How do I include them in the codes for go.pie & go.bar? Thanks you very much!

    color_discrete_map = {'a':'rgb(42,9,4)',
                              'b':'rgb(111,203,209)',
                              'c':'rgb(55,165,172),',
                              'd':'rgb(29,127,136)',
                              'e':'rgb(2,84,92)',
                              'f':'rgb(4,37,42)',
                              'g':'rgb(7,97,42)'
}

    unit_mix_pie.add_trace(go.Pie(labels=df.index, values=df['type']), row=1, col=1)


unit_mix_bar.add_trace(go.Bar(x=df.index, y=round(df['type'],0), marker=dict(
        color=px.colors.qualitative.Pastel2, color_discrete_map=color_discrete_map,
        line=dict(color='#000000', width=2)
    )), row=1, col=1)