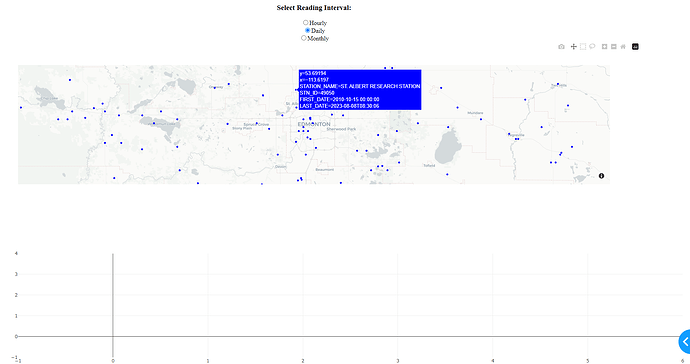
I’m creating a weather dashboard that pulls data from Environment Canada’s API. Currently there are two figures in the app, the top figure is a map of all the stations, you can click on a station, then the precipitation data will be rendered in the lower figure.
My issue is that when I click on the upper figure, the lower figure doesn’t appear. I ran the app removing the entire first figure, i.e., removing the first html.Div call and the first app.callback. When I do this, the figure appears.
I don’t understand why the lower figure isn’t rendering.
import geopandas as gpd
import pandas as pd
from shapely.geometry import Point
from pyproj import CRS
import plotly.express as px
import plotly.graph_objects as go
import dash
from dash import dcc, html, Input, Output
from bs4 import BeautifulSoup
import requests
import urllib.request
from dateutil.relativedelta import relativedelta

pd.set_option('display.max_columns', None, 'display.max_rows',None)

#station_url = 'https://api.weather.gc.ca/collections/climate-stations/items?limit=10000&startindex=0&f=csv'
#urllib.request.urlretrieve(station_url, 'climate-stations.csv')
df_weather_stations = pd.read_csv('climate-stations.csv')
print(df_weather_stations.columns)

df_weather_stations['geometry'] = df_weather_stations.apply(lambda x: Point((x.x, x.y)), axis=1)
dfg_weather_stations = gpd.GeoDataFrame(df_weather_stations, crs=CRS("EPSG:4326"), geometry=df_weather_stations.geometry)
dfg_weather_stations['LAST_DATE']=pd.to_datetime(dfg_weather_stations['LAST_DATE'])

map_fig = px.scatter_mapbox(dfg_weather_stations, lat='y', lon='x', mapbox_style='carto-positron',
                                center={'lat': 53.544, 'lon': -113.491},
                                hover_data=['STATION_NAME', 'FIRST_DATE', 'LAST_DATE'],
                                color_discrete_sequence=['grey'])

app = dash.Dash(__name__)


app.layout = html.Div([
    html.Div([
        html.H3('Select Reading Interval:'),
        dcc.RadioItems(['Hourly', 'Daily', 'Monthly'], 'Daily', id='type_select'),
        dcc.Graph(id='map', figure=map_fig)
    ], style= {'display': 'inline-block', 'width': '90%', 'margin':'auto',
                      'vertical-align': 'middle', 'text-align' : 'center'}),
    html.Div([
        dcc.Graph(id='precip')
    ])
])
@app.callback(
    Output('map', 'figure'),
    Input('type_select', 'value')
)
def update_map(value):
    print(value)
    if value == 'Hourly':
        df_filtered = dfg_weather_stations[dfg_weather_stations['HAS_HOURLY_DATA']=='Y']
        color = 'red'
    elif value == 'Daily':
        df_filtered = dfg_weather_stations[dfg_weather_stations['DLY_FIRST_DATE'].notnull()]
        color = 'blue'
    else:
        df_filtered = dfg_weather_stations[dfg_weather_stations['MLY_FIRST_DATE'].notnull()]
        color = 'green'
    map_fig = px.scatter_mapbox(df_filtered, lat='y', lon='x', mapbox_style='carto-positron',
                                center={'lat': 53.544, 'lon': -113.491},
                                hover_data=['STATION_NAME', 'STN_ID', 'FIRST_DATE', 'LAST_DATE'],
                                color_discrete_sequence=[color])
    map_fig.update_layout()
    return map_fig

@app.callback(
    Output('precip', 'figure'),
    Input('map', 'clickData')
)
def update_map_and_dropdown(clickData):
    ctx = dash.callback_context
    trigger_id = ctx.triggered[0]["prop_id"].split(".")[0]

    if trigger_id == "map":

        #print("Click", clickData)
        #print(clickData['points'][0]['customdata'][0])
        #get station id
        station_id = clickData['points'][0]['customdata'][1]
        climate_text = clickData['points'][0]['customdata'][0]
        web_url = 'https://api.weather.gc.ca/collections/climate-daily/items?datetime=1840-03-01%2000:00:00/2023-08-03%2000:00:00&STN_ID={}&sortby=PROVINCE_CODE,STN_ID,LOCAL_DATE&f=csv&limit=150000&startindex=0'.format(station_id)
        #urllib.request.urlretrieve(web_url, '{}_daily.csv'.format(station_id))
        #station_file = pd.read_csv('{}_daily.csv'.format(station_id))
        station_file = pd.read_csv('1886_daily.csv')
        station_file['LOCAL_DATE'] = pd.to_datetime(station_file['LOCAL_DATE'])
        date_end = station_file['LOCAL_DATE'].tolist()[-1]
        date_start = date_end - relativedelta(years=1)
        precip_fig = px.bar(station_file, x='LOCAL_DATE', y='TOTAL_PRECIPITATION', title=climate_text,
                            range_x=[date_start, date_end], template='plotly_white')
        precip_fig.update_layout()
        print(station_id, climate_text, 'render figure')
        return precip_fig

if __name__ == '__main__':
    app.run_server(debug=True)
Code I used to run the bottom figure only
import geopandas as gpd
import pandas as pd
from shapely.geometry import Point
from pyproj import CRS
import plotly.express as px
import plotly.graph_objects as go
import dash
from dash import dcc, html, Input, Output
from bs4 import BeautifulSoup
import requests
import urllib.request
from dateutil.relativedelta import relativedelta

pd.set_option('display.max_columns', None, 'display.max_rows',None)

app = dash.Dash(__name__)

app.layout = html.Div([
    html.Div([
        dcc.Graph(id='precip')
    ])
])


@app.callback(
    Output('precip', 'figure'),
    Input('precip', 'clickData')
)
def update_map_and_dropdown(clickData):
    #print("Click", clickData)
    #print(clickData['points'][0]['customdata'][0])
    #get station id
    station_id = 9010
    climate_text = 'COP UPPER'
    web_url = 'https://api.weather.gc.ca/collections/climate-daily/items?datetime=1840-03-01%2000:00:00/2023-08-03%2000:00:00&STN_ID={}&sortby=PROVINCE_CODE,STN_ID,LOCAL_DATE&f=csv&limit=150000&startindex=0'.format(station_id)
    urllib.request.urlretrieve(web_url, '{}_daily.csv'.format(station_id))
    station_file = pd.read_csv('{}_daily.csv'.format(station_id))
    station_file['LOCAL_DATE'] = pd.to_datetime(station_file['LOCAL_DATE'])
    date_end = station_file['LOCAL_DATE'].tolist()[-1]
    date_start = date_end - relativedelta(years = 1)
    precip_fig = px.bar(station_file, x='LOCAL_DATE', y='TOTAL_PRECIPITATION', title=climate_text, range_x=[date_start, date_end])
    precip_fig.update_layout()
    print('render figure')
    return precip_fig

if __name__ == '__main__':
    app.run_server(debug=True)
Here’s what the app currently looks like:
And here’s the stripped down app after clicking on the figure to show what the bottom figure should look like

