Scattermapbox - highlight clicked Marker

Hi everyone!

I have a problem with displaying clicked marker in scattermapbox in different style than other markers.

In docs I saw selected property for scattermapbox and I have set it to change color and opacity of clicked point on the map but when I click, nothing changes on the map itself.

Here is my map figure code:

 fig = go.Figure(go.Scattermapbox(
        lat=get_latitude(),
        lon=get_longitude(),
        mode='markers',
        marker=go.scattermapbox.Marker(
            size=9, color='green'
        ),
        selected=go.scattermapbox.Selected(
            marker = {
                "color":"red",
                "size":25,
                'opacity': 0.3
                }
            ),
        text=get_locations_name(),
        customdata=stations_general['id'],
    ))

    fig.update_layout(
        uirevision='foo',
        hovermode='closest',
        clickmode='event+select',
        mapbox=dict(
            accesstoken=token,
            bearing=0,
            center=go.layout.mapbox.Center(
                lat=21,
                lon=-158
            ),
            pitch=0,
            zoom=6
        ),
        margin = dict(l=0, r=0, t=0, b=0)
    )

So after a click marker stays size 9 and green, it never updates to 25-red.
Maybe selected is not the right property to address this at the first place, but my primary goal is not to redraw the map each time, if possible.

Could you please help me on this?
Thanks!
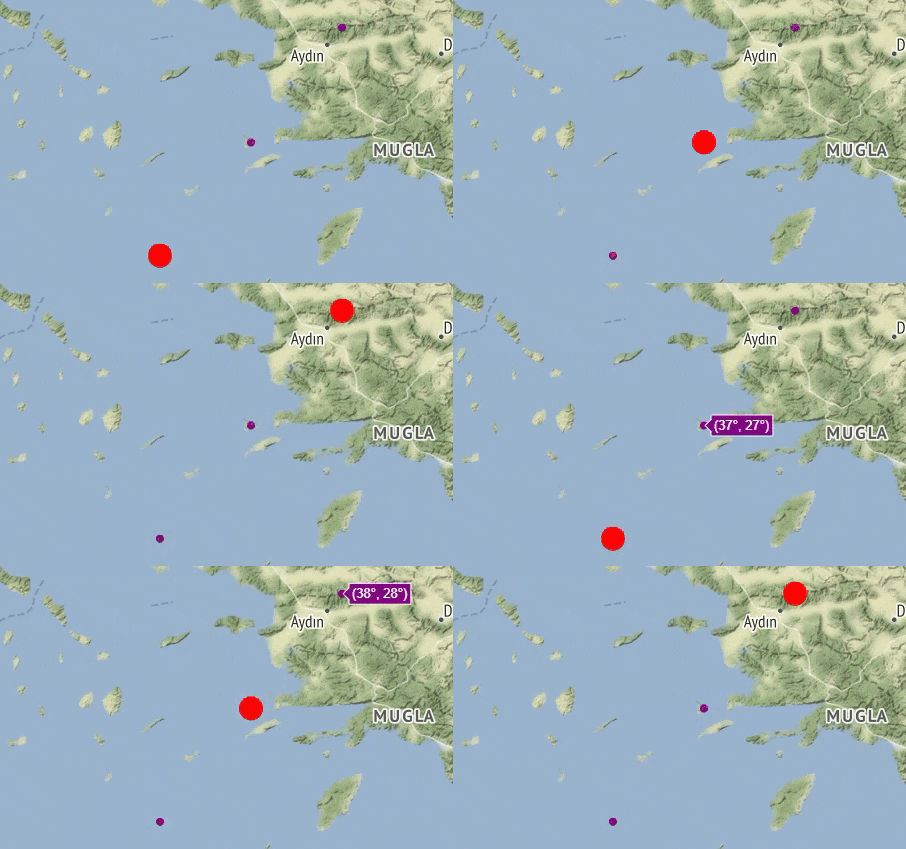
Hey @aleks1 ,

I think β€œselected” is the right property because it is working.

import plotly.graph_objects as go


fig = go.Figure(go.Scattermapbox(lat=[36,37,38],
                                 lon=[26,27,28],
                                 
                                 mode='markers',
                                 
                                 marker={'size':9,'color':'purple'},
                                 
                                 selected=go.scattermapbox.Selected(marker = {"color":"red", "size":25}
                                                                    )
                                 )
                )

fig.update_layout(clickmode='event+select',

                  mapbox = {'style': "stamen-terrain",
                            'center': {'lon': 27.0, 'lat': 37.0 },
                            'zoom': 6},

                  margin = dict(l=0, r=0, t=0, b=0)
                  )

fig.show()

example

PS: My plotly version is 5.13.0

1 Like

Hi @akroma,

Thank you so much for your answer! Sadly I did not remember to check the versions and my Plotly was v5.11.0, and it worked after the upgrade as you said!
Unfortunately, it did not work inside Dash app until I upgraded dash to the latest version as well - v2.8.1.

Once again, thanks!

1 Like