Scattermapbox figure displayed below the map when using a slider

Hi,

I am trying to display different Scattermapbox figures using a Slider to update the visible figures at each step.
Here is a snippet of a simplified version of my code:

import plotly.graph_objs as go

fig = go.Figure()

# Define the traces
trace1 = go.Scattermapbox(
    lat=[40.71, 40.72, 40.73],
    lon=[-74.00, -74.01, -74.02],
    mode='markers',
    marker=dict(size=10, color='blue'),
    below='traces',
    visible=True
)

trace2 = go.Scattermapbox(
    lat=[40.72, 40.73, 40.74],
    lon=[-74.01, -74.02, -74.03],
    mode='markers',
    marker=dict(size=10, color='red'),
    below='traces',
    visible=False
)

trace3 = go.Scattermapbox(
    lat=[40.73, 40.74, 40.75],
    lon=[-74.02, -74.03, -74.04],
    mode='markers',
    marker=dict(size=10, color='green'),
    below='traces',
    visible=False
)

# Add the traces to the figure
fig.add_trace(trace1)
fig.add_trace(trace2)
fig.add_trace(trace3)

# Add the slider
steps = []
for i in range(3):
    step = dict(
        method='update',
        args=[{'visible': [j == i for j in range(3)]}],
    )
    steps.append(step)

sliders = [dict(
    active=0,
    steps=steps
)]

fig.update_layout(
    sliders=sliders,
    mapbox_style='carto-positron',
    mapbox=dict(
        center=dict(lat=40.725, lon=-74.005),
        zoom=11,
    )
)

fig.show()

The issue is that the traces that were initially set as non visible seem to be rendered below the map layer as I can still see the hover data, only the traces that were initially visible are displayed above the map:

I have tried using the below argument but it did not change anything.
How could I display the figure that were initially non visible above the map layer when moving the slider ?

Thanks! :slight_smile:

Can I have a question that your expectations that

  • If slider was 1, trace 1 shows
  • If slider was 2, trace 1 and 2 show
  • If slider was 3, trace 1 and 2 and 3 show?

Or:

  • If slider was 1, trace 1 shows
  • If slider was 2, trace 2 shows
  • If slider was 3, trace 3 show?

I was expected the second situation you mentioned: for each position of the slider, a different trace should be displayed.
But as showed on the two pictures, the traces that were not visible at first ended up being displayed below the map.

Also, this is just a simplified version to reproduce my issue. In reality, I will be combining different traces for each slider position but I would still need to select those that should be showed depending on the slider position.

1 Like

If you can use Dash. I think you can do as below:
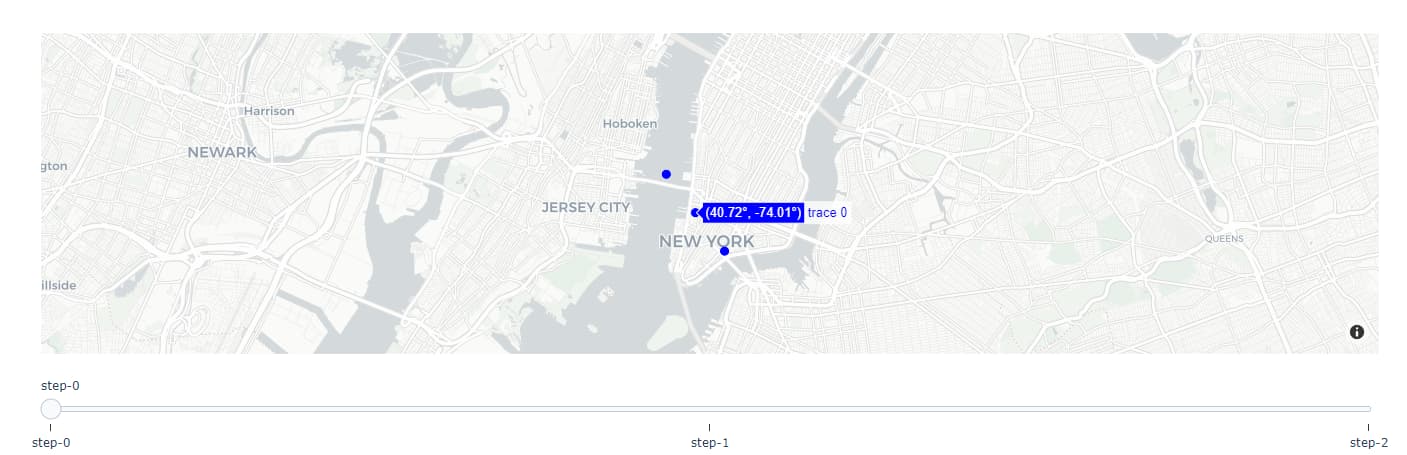
Option 1: If slider was 1, trace 1 shows, If slider was 2, trace 1 and 2 show, If slider was 3, trace 1 and 2 and 3 show

from dash import Dash, dcc, html, Input, Output
import plotly.graph_objs as go

external_stylesheets = ['https://codepen.io/chriddyp/pen/bWLwgP.css']

app = Dash(__name__, external_stylesheets=external_stylesheets)

app.layout = html.Div([
    dcc.Slider(1, 3, 1,
               value=1,
               id='my-slider'
    ),
    dcc.Graph(id='slider-output-container',figure={})
])

@app.callback(
    Output('slider-output-container', 'figure'),
    Input('my-slider', 'value'))
def update_output(value):
    if value == 1:
        fig = go.Figure()
        # Define the traces
        trace1 = go.Scattermapbox(
            lat=[40.71, 40.72, 40.73],
            lon=[-74.00, -74.01, -74.02],
            mode='markers',
            marker=dict(size=10, color='blue'),
            below='traces',
            visible=True) 
        fig.add_trace(trace1)
        fig.update_layout(mapbox_style='carto-positron',mapbox=dict(
        center=dict(lat=40.725, lon=-74.005),
        zoom=11)
        )
    elif value == 2:
        fig = go.Figure()
        # Define the traces
        trace1 = go.Scattermapbox(
            lat=[40.71, 40.72, 40.73],
            lon=[-74.00, -74.01, -74.02],
            mode='markers',
            marker=dict(size=10, color='blue'),
            below='traces',
            visible=True)
        trace2 = go.Scattermapbox(
            lat=[40.72, 40.73, 40.74],
            lon=[-74.01, -74.02, -74.03],
            mode='markers',
            marker=dict(size=10, color='red'),
            below='traces',
            visible=True
        )
        fig.add_trace(trace1)
        fig.add_trace(trace2)
        fig.update_layout(mapbox_style='carto-positron',mapbox=dict(
        center=dict(lat=40.725, lon=-74.005),
        zoom=11)
        )        
    elif value == 3:
        fig = go.Figure()
        # Define the traces
        trace1 = go.Scattermapbox(
            lat=[40.71, 40.72, 40.73],
            lon=[-74.00, -74.01, -74.02],
            mode='markers',
            marker=dict(size=10, color='blue'),
            below='traces',
            visible=True)
        trace2 = go.Scattermapbox(
            lat=[40.72, 40.73, 40.74],
            lon=[-74.01, -74.02, -74.03],
            mode='markers',
            marker=dict(size=10, color='red'),
            below='traces',
            visible=True
        )
        trace3 = go.Scattermapbox(
            lat=[40.73, 40.74, 40.75],
            lon=[-74.02, -74.03, -74.04],
            mode='markers',
            marker=dict(size=10, color='green'),
            below='traces',
            visible=True
        )
        
        fig.add_trace(trace1)
        fig.add_trace(trace2)
        fig.add_trace(trace3)        
        fig.update_layout(mapbox_style='carto-positron',mapbox=dict(
        center=dict(lat=40.725, lon=-74.005),
        zoom=11)
        )         
        
    return fig

if __name__ == '__main__':
    app.run_server(debug=False)

Recording 2023-04-07 161205

Option 2: If slider was 1, trace 1 shows, If slider was 2, trace 2 shows, If slider was 3, trace 3 shows

from dash import Dash, dcc, html, Input, Output
import plotly.graph_objs as go

external_stylesheets = ['https://codepen.io/chriddyp/pen/bWLwgP.css']

app = Dash(__name__, external_stylesheets=external_stylesheets)

app.layout = html.Div([
    dcc.Slider(1, 3, 1,
               value=1,
               id='my-slider'
    ),
    dcc.Graph(id='slider-output-container',figure={})
])

@app.callback(
    Output('slider-output-container', 'figure'),
    Input('my-slider', 'value'))
def update_output(value):
    if value == 1:
        fig = go.Figure()
        # Define the traces
        trace1 = go.Scattermapbox(
            lat=[40.71, 40.72, 40.73],
            lon=[-74.00, -74.01, -74.02],
            mode='markers',
            marker=dict(size=10, color='blue'),
            below='traces',
            visible=True) 
        fig.add_trace(trace1)
        fig.update_layout(mapbox_style='carto-positron',mapbox=dict(
        center=dict(lat=40.725, lon=-74.005),
        zoom=11)
        )
    elif value == 2:
        fig = go.Figure()
        trace2 = go.Scattermapbox(
            lat=[40.72, 40.73, 40.74],
            lon=[-74.01, -74.02, -74.03],
            mode='markers',
            marker=dict(size=10, color='red'),
            below='traces',
            visible=True
        )
        fig.add_trace(trace2)
        fig.update_layout(mapbox_style='carto-positron',mapbox=dict(
        center=dict(lat=40.725, lon=-74.005),
        zoom=11)
        )        
    elif value == 3:
        fig = go.Figure()
        trace3 = go.Scattermapbox(
            lat=[40.73, 40.74, 40.75],
            lon=[-74.02, -74.03, -74.04],
            mode='markers',
            marker=dict(size=10, color='green'),
            below='traces',
            visible=True
        )
        fig.add_trace(trace3)        
        fig.update_layout(mapbox_style='carto-positron',mapbox=dict(
        center=dict(lat=40.725, lon=-74.005),
        zoom=11)
        )         
        
    return fig

if __name__ == '__main__':
    app.run_server(debug=False)

Recording 2023-04-07 161235

1 Like

Thanks for your answer,

Actually, this was what I did at first but because of the number of information I want to show on the figure (markers, lines and hover data), it was taking too much time to update the figure using a slider with Dash.

That’s why I was trying to create the figure beforehand with an embedded slider so that I don’t need to re-build any figures when moving the slider.

1 Like

I’m not sure the slider in the graph itself can do what you want. Hope you will find a good solution.

1 Like