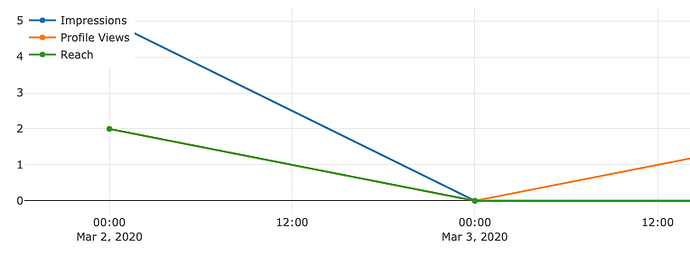
Hello, I can’t seem to figure out why my X-axis in my Scatter graph is displaying time ticks when the series passed to the x value contains only dates in the format: 2020-03-03.
When I first consume my data, I convert the date column to a datetime object (to prepare to filter it based upon a datepicker component).
df['date'] = pd.to_datetime(df['date'])
I have confirmed the date column shows in the format 2020-03-03, etc.
In the callback for my DatePicker, I filter my dataframe to only records between the start and end date of the DatePicker and then set the Date column as my x-axis in the traces.
@app.callback(
    Output("profile-insight","figure"),
    [Input("date-picker-range","start_date"),
    (Input("date-picker-range","end_date"))]
)
def update_graph(start_date,end_date):
    start_date = pd.to_datetime(start_date)
    end_date = pd.to_datetime(end_date)

    filtered_df = df[df.date.between(
        dt.datetime.strftime(start_date, "%Y-%m-%d"),
        dt.datetime.strftime(end_date, "%Y-%m-%d")
    )]

    trace1 = go.Scatter(
        x = filtered_df['date'],
        y = filtered_df['value'].where(filtered_df['insight_type'] == 'impressions'),
        name='Impressions'
    )
...
I then return the figure with the traces.
return {
        "data": [trace1,trace2,trace3],
        "layout": go.Layout(
            title = "Profile Insight",
            showlegend=True,
            height=300,
            legend=dict(
                x=0,
                y=1.0
            ),
            margin=dict(l=40, r=0, t=40, b=30)
        )
    }
I have tried converting filtered_df[date] with dt.date and have attempted converting it to a string, but I still don’t get only date ticks (no time) on the x-axis. What is strange is I have a separate app.py I originally created without the callback and the x-axis shows up perfectly with only the dates (sourcing the same dataframe) - which makes me feel as though the filtering of the dataframe is where the problem is occuring. Can anyone point me in the right direction?
