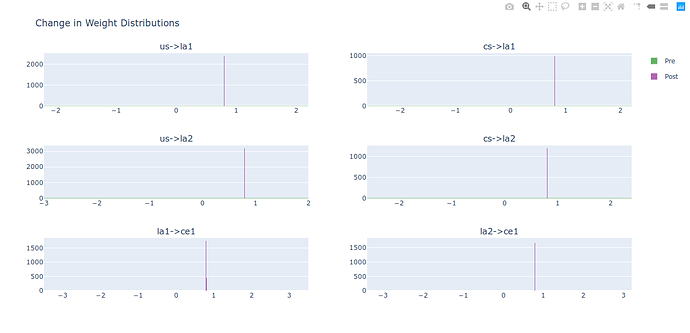
I’m trying to plot several histograms and save them in one plot. This is what my plot looks like:
However, I notice that when I save the plot, my data disappears:
I suspect that this is due to the delta function-like distributions. How do I ensure my plot is saved correctly?

