Hello,
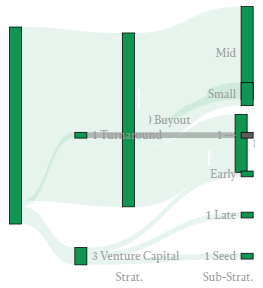
I have several Sankey diagrams as the one below:

There is an obvious collision between the labels of the second and third column.
As a workaround, I would like to move the second bar on the left, to get the below ouput:

It is relatively easy to position theses bars along the x axis; I could for instance pass an array, as below, for x:
    fig = go.Figure(data=[go.Sankey(
        node=dict(
            pad=5, thickness=8, line=dict(color="black", width=0.5),
            color=list_nodes_colors,
            label=["{} {}".format(i, j) for i,j in zip(val_nodes2, nodes2)],
            x=[0.0, 0.3, 0.3, 0.3, 1.0, 1.0, 1.0, 1.0, 1.0, 1.0, 1.0],


        ),
        link=dict(source=src2, target=trgt2, value=val2, color=colorLink2),
        domain={
            "x": x_domain_boundaries2,
            "y": [0.1, 0.9]
        }
    )])
Problem is, if X is passed, then Y must also be passed, otherwise X is ignored. In my case I’m very happy with the Y positioning, and I would like to pass something as “auto” for the y node positionning.
While it’s quite clear that Y_0 is the top of the plot area, passing a full Y array so that the figure looks pretty is not that obvious, because it depends on the height of each bar, + the pad between the bars. For instance, the group of bars in the second column cannot be positionned with [0, 0.5, 1], and those of the third column cannot be positionned with [0, 0.16, 0.33 0.5, 0.66, 0.83 1]
I tried to pass [0.5, 0, 0.5, 1, 0, 0.16, 0.33, 0.5, 0.66, 0.83, 1] for Y, but it’s a mess; the sankey is ugly and there are bars all over the place.
If I could pass y=“Auto”, that would make my life much easier