I’m experimenting with the plotly_selected event and I’m encountering a few problems.
My goal is to allow the user to select a portion of the plot and then they can press a button to export that data into as a plot in a separate div. The plotly_selected section of my code below is based on the Lasso Example, so I know that there will be problems with the way I’m attempting to replot the data.
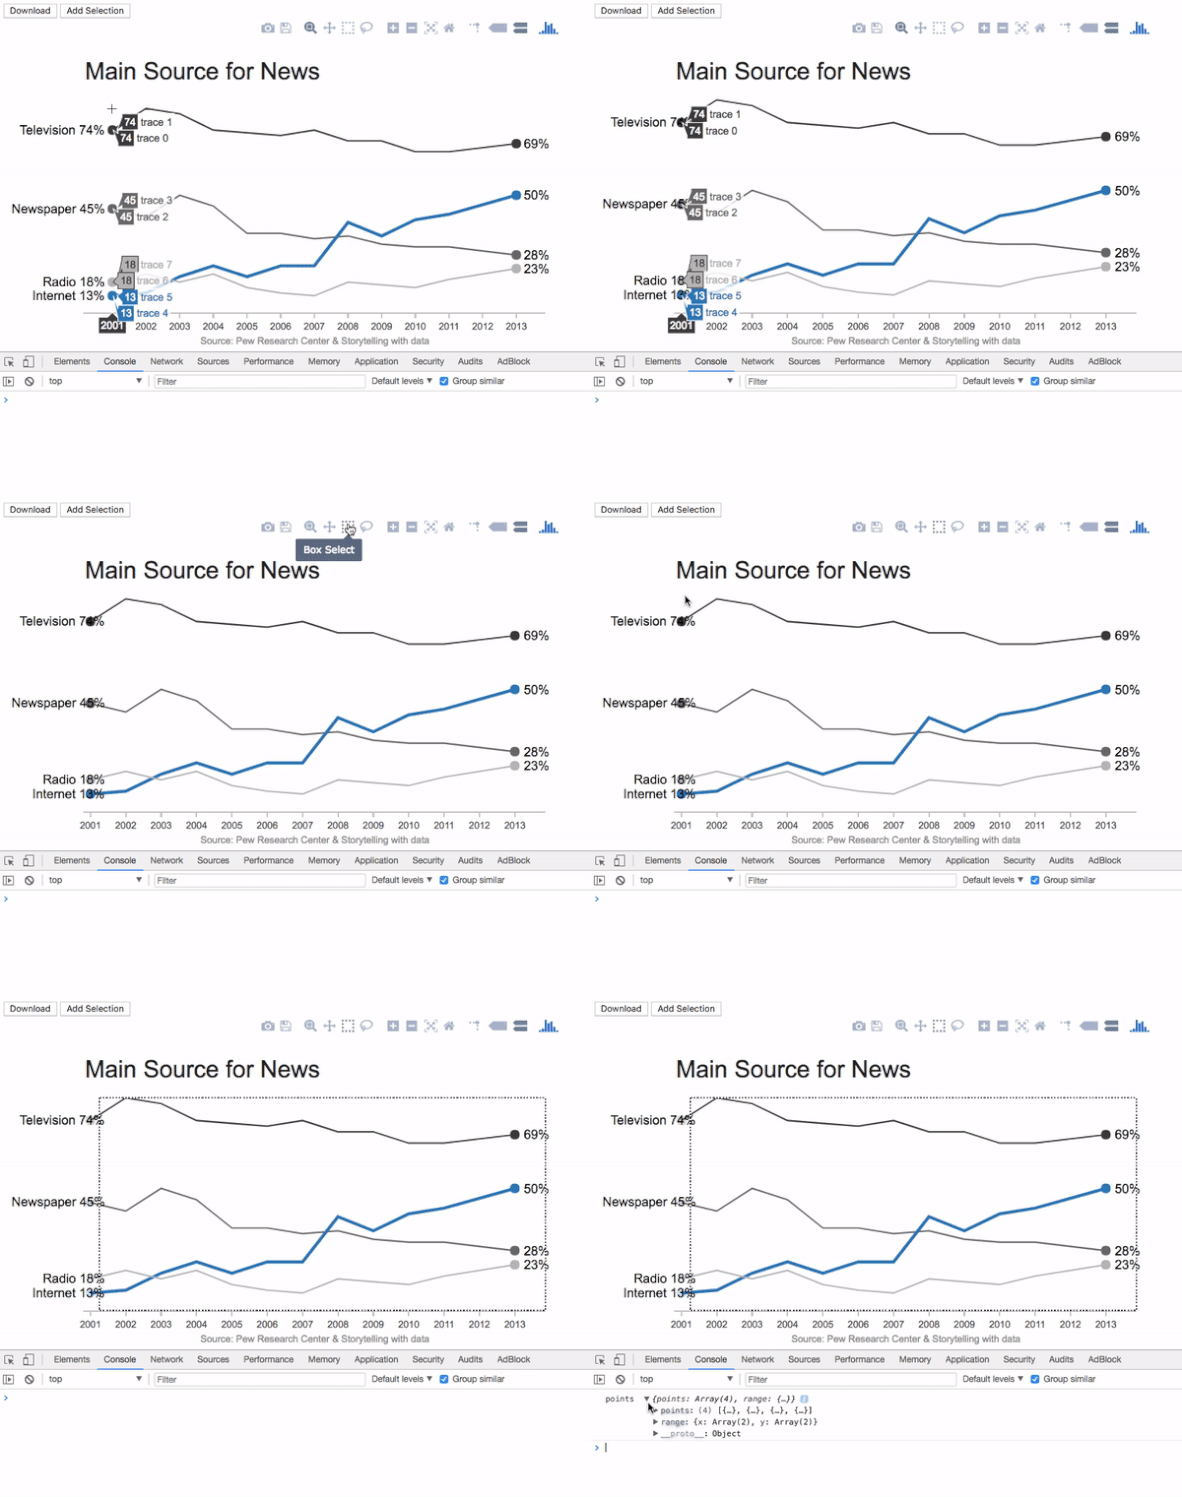
The graphDiv.on(‘plotly_selected’…) section never gets called.
<!DOCTYPE html>
<html lang="en">

<head>
    <!-- Plotly.js -->
    <script src="https://cdn.plot.ly/plotly-latest.min.js"></script>
</head>

<body>
    <div>

        <button onclick="downloadMainPlot()">Download</button>
        <button onclick="addSelection()">Add Selection</button>
    </div>
    <div id="graph">
        <!-- Plotly chart will be drawn inside this DIV -->
    </div>
    <div id="selectedPlots">
        <!-- All confirmed selections will be drawn inside this DIV -->
    </div>
    <script>
        var graphDiv = document.getElementById('graph');
        var xData = [
            [2001, 2002, 2003, 2004, 2005, 2006, 2007, 2008, 2009, 2010, 2011, 2013],
            [2001, 2002, 2003, 2004, 2005, 2006, 2007, 2008, 2009, 2010, 2011, 2013],
            [2001, 2002, 2003, 2004, 2005, 2006, 2007, 2008, 2009, 2010, 2011, 2013],
            [2001, 2002, 2003, 2004, 2005, 2006, 2007, 2008, 2009, 2010, 2011, 2013]
        ];

        var yData = [
            [74, 82, 80, 74, 73, 72, 74, 70, 70, 66, 66, 69],
            [45, 42, 50, 46, 36, 36, 34, 35, 32, 31, 31, 28],
            [13, 14, 20, 24, 20, 24, 24, 40, 35, 41, 43, 50],
            [18, 21, 18, 21, 16, 14, 13, 18, 17, 16, 19, 23]
        ];

        var colors = ['rgba(67,67,67,1)', 'rgba(115,115,115,1)', 'rgba(49,130,189, 1)',
            'rgba(189,189,189,1)'
        ];

        var lineSize = [2, 2, 4, 2];

        var labels = ['Television', 'Newspaper', 'Internet', 'Radio'];

        var data = [];

        for (var i = 0; i < xData.length; i++) {
            var result = {
                x: xData[i],
                y: yData[i],
                type: 'scatter',
                mode: 'lines',
                line: {
                    color: colors[i],
                    width: lineSize[i]
                }
            };
            var result2 = {
                x: [xData[i][0], xData[i][11]],
                y: [yData[i][0], yData[i][11]],
                type: 'scatter',
                mode: 'markers',
                marker: {
                    color: colors[i],
                    size: 12
                }
            };
            data.push(result, result2);
        }

        var layout = {
            showlegend: false,
            xaxis: {
                showline: true,
                showgrid: false,
                showticklabels: true,
                linecolor: 'rgb(204,204,204)',
                linewidth: 2,
                autotick: false,
                ticks: 'outside',
                tickcolor: 'rgb(204,204,204)',
                tickwidth: 2,
                ticklen: 5,
                tickfont: {
                    family: 'Arial',
                    size: 12,
                    color: 'rgb(82, 82, 82)'
                },
                // Can't use because it limits the option to view specific portions. Forces user to view all of y-axixs
                // rangeslider: {}
            },
            yaxis: {
                showgrid: false,
                zeroline: false,
                showline: false,
                showticklabels: false,
                // Forces user to view all of y-axis on selection
                // rangeslider: {}
            },
            autosize: false,
            margin: {
                autoexpand: false,
                l: 100,
                r: 20,
                t: 100
            },
            annotations: [
                {
                    xref: 'paper',
                    yref: 'paper',
                    x: 0.0,
                    y: 1.05,
                    xanchor: 'left',
                    yanchor: 'bottom',
                    text: 'Main Source for News',
                    font: {
                        family: 'Arial',
                        size: 30,
                        color: 'rgb(37,37,37)'
                    },
                    showarrow: false,
                },
                {
                    xref: 'paper',
                    yref: 'paper',
                    x: 0.5,
                    y: -0.1,
                    xanchor: 'center',
                    yanchor: 'top',
                    text: 'Source: Pew Research Center & Storytelling with data',
                    showarrow: false,
                    font: {
                        family: 'Arial',
                        size: 12,
                        color: 'rgb(150,150,150)'
                    }
                }
            ]
        };

        for (var i = 0; i < xData.length; i++) {
            var result = {
                xref: 'paper',
                x: 0.05,
                y: yData[i][0],
                xanchor: 'right',
                yanchor: 'middle',
                text: labels[i] + ' ' + yData[i][0] + '%',
                showarrow: false,
                font: {
                    family: 'Arial',
                    size: 16,
                    color: 'black'
                }
            };
            var result2 = {
                xref: 'paper',
                x: 0.95,
                y: yData[i][11],
                xanchor: 'left',
                yanchor: 'middle',
                text: yData[i][11] + '%',
                font: {
                    family: 'Arial',
                    size: 16,
                    color: 'black'
                },
                showarrow: false
            };

            layout.annotations.push(result, result2);
        }

        Plotly.newPlot(graphDiv, data, layout, { displayModeBar: false });

        function downloadMainPlot() {
            Plotly.downloadImage(graphDiv, { format: 'png', width: 800, height: 600, filename: 'newplot' });
        }

        var selectCount = 0;
        function addSelection() {

            var newSelect = document.createElement('DIV');
            var newID = 'plot' + selectCount.toString();
            newSelect.setAttribute("id", newID);
            document.getElementById('selectedPlots').appendChild(newSelect);

            console.log('y');
            graphDiv.on('plotly_selected', function (eventData) {
                var x = [];
                var y = [];

                console.log(eventData)

                eventData.points.forEach(function (pt) {
                    x.push(pt.x);
                    y.push(pt.y);
                });
                layout.annotations.text = "New Plot #" + selectCount.toString();
                Plotly.newPlot(
                    document.getElementById(newID),
                    {
                        x: x,
                        y: y,
                    },
                    layout,
                    {
                        displayModeBar: false
                    }
                );
            });

            newSelect = null;
            selectCount++;
        }
    </script>
</body>

</html>
If I remove the on.(‘plotly_selected’…); section from the function and place it with everything else it still doesn’t get called.
Advice?
Notes:
- The data used in the plot came from a random example I found through the plot.ly community
- I even tried plotly_slected (there’s a typo in the Select-Event documentation).

