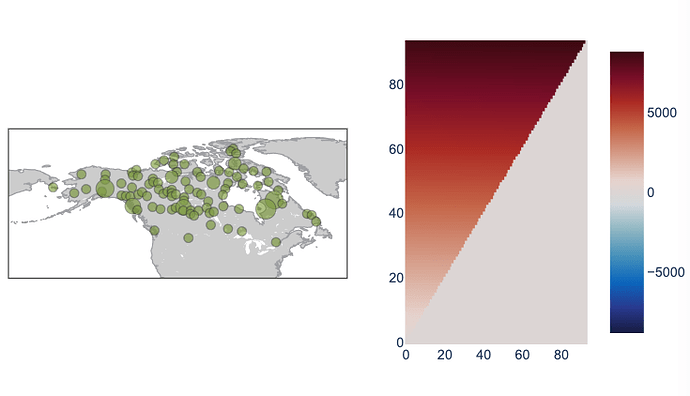
I’m trying to scale my go.Scattergeo plot to a similar height as the go.Heatmap in my mixed_subplots (figure shown below). I’ve tried varying combinations of the height and weight in the update_layout command after each subplot, but it only seems to increase the height of my Heatmap but not my Scattergeo…
Code:
bigfig = make_subplots(rows=1, cols=2, specs=[[{"type": "scattergeo"}, {"type": "xy"}]],
column_widths=[0.6,0.4])

bigfig.add_trace(go.Scattergeo(lat=rescoord[:,1], lon=rescoord[:,0], opacity=0.8,
textfont={'family':'Arial'}), row=1, col=1)

bigfig.update_traces(marker=dict(color=['olivedrab']*111,
size=8.*np.sqrt(sp_graph.n_samples_per_obs_node_permuted),
line=dict(color='black', width=0.5)))

bigfig.update_layout(autosize=True)

bigfig.update_geos(resolution=50,coastlinecolor='#9fa0a4',landcolor='#cccccc',
fitbounds='locations', projection={'type':'robinson'},
center={'lat':np.median(rescoord[:,1]),'lon':np.median(rescoord[:,0])})

bigfig.add_trace(go.Heatmap(z=resmat, colorscale='balance', showscale=True, zmid=0), row=1, col=2)

bigfig.update_layout(font_family='Arial')

bigfig.update_xaxes(showspikes=True)

bigfig.update_yaxes(showspikes=True)
