Render Colorbar Issues

I’m having issues rendering a color bar when I’m loading various graphs. I am preprocessing some figures and exporting them to JSON. I then read in the JSON file in a callback and output the figure. The problem arises when selecting a new graph in the dropdown; the colorbar does not re-render when loading in the new graph.

The plot renders correctly when changing from a blank graph to a populated graph, but fails to render the colorbar when moving from a populated graph to a populated graph.

@app.callback(Output('corner_plot_figure', 'figure'),
              [Input('em_campaign_dropdown', 'value'),
               Input('radioitems-inline-input', 'value')])
def em_generate_req_corner_plot(pathname, radio):
    if pathname is not None:
        zb_results = os.path.join(os.getcwd(), 'zb-results')
        campaign_results = os.path.join(zb_results, pathname)
        plotly_directory = os.path.join(campaign_results, 'plotly_plots')
        plotly_plots = os.listdir(plotly_directory)

        if radio == 1:
            fig_dir_list = [plot for plot in plotly_plots if plot.endswith("Requested_Parameters_Corner_Plot.json")]
            if len(fig_dir_list) < 1:
                return ""

            figure_dir = os.path.join(plotly_directory, fig_dir_list[0])

            with open(figure_dir) as json_file:
                data = json.load(json_file)

            return data

        else:
            fig_dir_list = [plot for plot in plotly_plots if plot.endswith("Realised_Parameters_Corner_Plot.json")]
            if len(fig_dir_list) < 1:
                return ""

            figure_dir = os.path.join(plotly_directory, fig_dir_list[0])

            with open(figure_dir) as json_file:
                data = json.load(json_file)

            return data
    else:
        return ""

Hello @ted.haley are you preprocessing the figures using plotly’s methods (fig.update_layout etc.) or with more manual operations? The issue might come from the preprocessing steps. To help debugging, could you post here the json content of the figures (or upload it somewhere if it’s too big) to be sure that the colorbar is defined correctly?

Hi Emmanelle, here’s a breakdown of my code.

Creates corner plot figure:

def optimisation_parameter_corner_plot(
        plot_df,
        index_col='sample',
        pivot_col='parameter',
        value_col='realised',
        colour_col='measurement_mean',
        title="Corner Plot: Optimisation Parameters",
        labels = None,
):
    """
    Pivots the parameter dataframe to make corner plot

    :param plot_df:
    :param index_col:
    :param pivot_col:
    :param value_col:
    :param colour_col:
    :param title:
    :return:
    """

    # pivot the dataframe
    _pdf = plot_df.pivot(index=index_col, columns=pivot_col, values=value_col).reset_index(index_col)
    _pdf = _pdf.merge(plot_df[[index_col, colour_col]].drop_duplicates(), on=[index_col], how='inner')

    # corner plot
    fig = px.scatter_matrix(_pdf, color=colour_col, height=900, color_continuous_scale=px.colors.sequential.Viridis, labels=labels)
    fig.update_traces()

    # plot formatting
    fig.update_layout(
        dragmode='select',
        height=950,
        hovermode='closest',
        title=title)

    # layout formatting
    fig.update_traces(
        marker=dict(size=10, line_color='white', line_width=0.5),
        showupperhalf=False,
        diagonal_visible=False,
    )

    return fig

Save plotly figure to JSON and HTML:

fig_json = plotly_figure.to_plotly_json()
json_path = os.path.join(parameters_dict['plotly_directory'], f"{slugify(f'Plotly {title}')}.json")
html_path = os.path.join(parameters_dict['plotly_directory'], f"{slugify(f'Plotly {title}')}.html")

# save to json
with open(json_path, 'w', encoding='UTF-8') as fp:
    json.dump(fig_json, fp, cls=plotly.utils.PlotlyJSONEncoder)

# save to html
plotly.offline.plot(plotly_figure, filename=html_path, auto_open=False)
gc.collect()

Layout:

dcc.Dropdown(id='em_campaign_dropdown',
             options=[{'label': campaign, 'value': campaign} for campaign in
                      file_names()],
             value=[{'label': campaign, 'value': campaign} for campaign in
                    file_names()][0]['value'],
             style={'marginBottom': '1em'}
             ),

dbc.RadioItems(
    options=[
        {"label": "Realized Values", "value": 2},
        {"label": "Requested Values", "value": 1},
    ],
    value=2,
    id="radioitems-inline-input",
    inline=True,
    style={'marginBottom': '1em'}
),

dcc.Graph(id='corner_plot_figure'),

Callback:

@app.callback(Output('corner_plot_figure', 'figure'),
              [Input('em_campaign_dropdown', 'value'),
               Input('radioitems-inline-input', 'value')])
def em_generate_req_corner_plot(pathname, radio):
    if pathname is not None:
        zb_results = os.path.join(os.getcwd(), 'zb-results')
        campaign_results = os.path.join(zb_results, pathname)
        plotly_directory = os.path.join(campaign_results, 'plotly_plots')
        plotly_plots = os.listdir(plotly_directory)

        if radio == 1:
            fig_dir_list = [plot for plot in plotly_plots if plot.endswith("Requested_Parameters_Corner_Plot.json")]
            if len(fig_dir_list) < 1:
                return ""

            figure_dir = os.path.join(plotly_directory, fig_dir_list[0])

            with open(figure_dir) as json_file:
                data = json.load(json_file)

            return data

        else:
            fig_dir_list = [plot for plot in plotly_plots if plot.endswith("Realised_Parameters_Corner_Plot.json")]
            if len(fig_dir_list) < 1:
                return ""

            figure_dir = os.path.join(plotly_directory, fig_dir_list[0])

            with open(figure_dir) as json_file:
                data = json.load(json_file)

            return data
    else:
        return ""

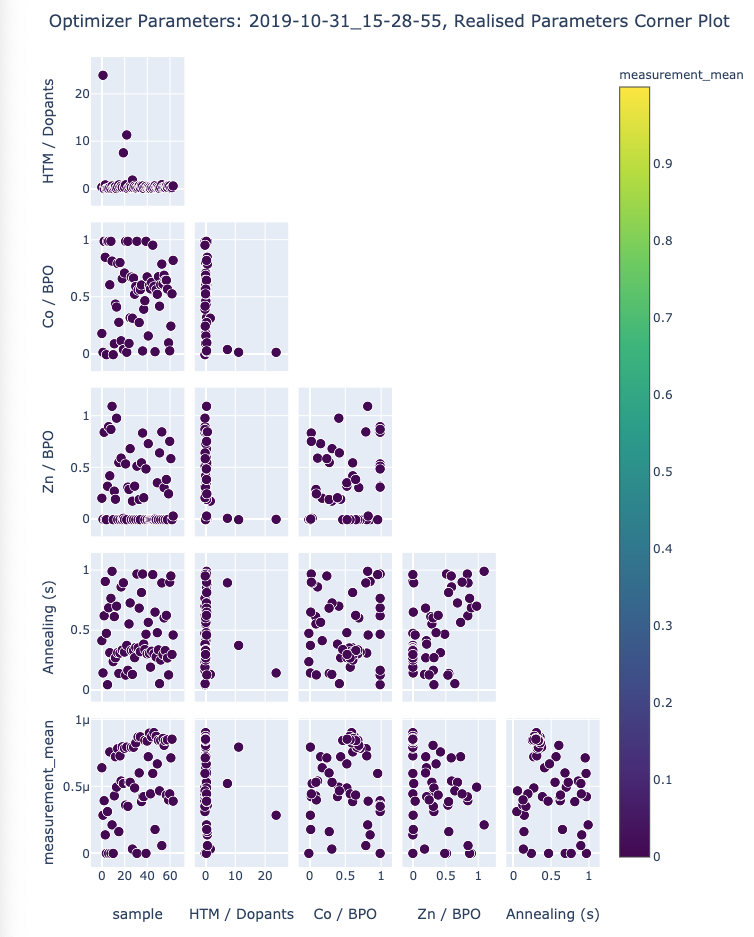
Here is the JSON. I will note that this problem is only occurring when switching between corner plots with different colorbar scales.

{
 "data": [
  {
   "dimensions": [
    {
     "axis": {
      "matches": true
     },
     "label": "sample",
     "values": [
      0,
      1,
      2,
      3,
      4,
      5,
      6,
      7,
      8,
      9,
      10,
      11,
      12,
      13,
      14,
      15,
      16,
      17,
      18,
      19,
      20,
      21,
      22,
      23,
      24,
      25,
      26,
      27,
      28,
      29,
      30,
      31,
      32,
      33,
      34,
      35,
      36,
      37,
      38,
      39,
      40,
      41,
      42,
      43,
      44,
      45,
      46,
      47,
      48,
      49,
      50,
      51,
      52,
      53,
      54,
      55,
      56,
      57,
      58,
      59,
      60,
      61,
      62,
      63
     ]
    },
    {
     "axis": {
      "matches": true
     },
     "label": "HTM / Dopants",
     "values": [
      0.3778457268588157,
      24.10661235584423,
      0.04935291222746211,
      0.8575124652588259,
      0.048506592218340056,
      0.07690108653007079,
      0.11265237760184026,
      0.32420686982024033,
      0.08686599086333552,
      0.6139224603922184,
      0.07352306211428354,
      0.2858145272974388,
      0.4839227804600762,
      0.0810653393917342,
      0.3419673574333336,
      0.8554057633799311,
      0.3434652235946534,
      0.5875506913090938,
      0.3195102814398203,
      7.663545674887861,
      0.3463258678231752,
      0.8673597652194127,
      11.450203397935214,
      0.06396165786404863,
      0.29674251504752946,
      0.5867479116001781,
      0.3289139663560203,
      1.8831203043630107,
      0.3141088467041987,
      0.6169439542199757,
      0.3548885596264821,
      0.13425986198777046,
      0.3079361962417536,
      0.6354085787431581,
      0.2810381070407906,
      0.6780123827732936,
      0.6272043793370605,
      0.09971978070840294,
      0.3859810499842676,
      0.5419443947787275,
      0.2388943799017862,
      0.3911479576750607,
      0.2599502985282022,
      0.076652079634854,
      0.2886572863212972,
      0.08839655577505072,
      0.29618430954704456,
      0.6822068247228167,
      0.32220779997650834,
      0.4990833560272699,
      0.2794585080695375,
      0.1220406663477315,
      0.3243244720508845,
      0.9052814282347152,
      0.3063482379422045,
      0.299095473679071,
      0.28463689789251545,
      0.5830137785582955,
      0.3354041654490956,
      0.7076807220364086,
      0.6270212110507685,
      0.16754578760562958,
      0.2717865366838009,
      0.6299323209112135
     ]
    },
    {
     "axis": {
      "matches": true
     },
     "label": "Co / BPO",
     "values": [
      0.18697675762488056,
      0.02091088871626938,
      1.0,
      0.859254863008087,
      0.0,
      1.0,
      1.0,
      0.6163779250870822,
      1.0,
      0.8254465694762417,
      0.0,
      0.09593218852562524,
      0.4462898020231079,
      0.42049114168829815,
      0.8036238496026056,
      0.2858829050202888,
      0.8122345783793208,
      0.12256355875533627,
      0.6696923549643192,
      0.04588629117090262,
      0.7200835517607184,
      1.0,
      0.021545664094010115,
      1.0,
      0.09945284361832137,
      0.3255781892903774,
      0.684388989159836,
      0.32214375840532955,
      0.6755057782637764,
      0.5332795427828803,
      0.6021396681813441,
      1.0,
      0.568237244213045,
      0.2834442020067192,
      0.5736617676183543,
      0.6146078265160053,
      0.0330741439393079,
      0.4013960788720661,
      0.4757305069059662,
      1.0,
      0.6859703289194915,
      0.1652844967652214,
      0.6097683747065048,
      0.5803538733546743,
      0.638041269695537,
      0.9655447343424428,
      0.6001982448249062,
      0.02623832666262234,
      0.5731187843972929,
      0.532846585954485,
      0.687677452430986,
      0.4280629316252866,
      0.6172164673751953,
      0.798983284708732,
      0.6224163843714361,
      0.7006341268969779,
      0.6582047383515128,
      0.6563468114342058,
      0.5785146956936711,
      0.1045549277129605,
      0.03425714831283114,
      0.25198049197696754,
      0.5367907760205073,
      0.8318126564426807
     ]
    },
    {
     "axis": {
      "matches": true
     },
     "label": "Zn / BPO",
     "values": [
      0.2089787782388624,
      0.0038573752982839758,
      0.8505624004082757,
      0.0,
      0.0,
      0.3257231428009848,
      0.905135591909927,
      0.42704359031419614,
      0.8784099386623865,
      1.1031959416450856,
      0.0,
      0.2778355888791241,
      0.19928700881328648,
      0.9875383026014825,
      0.0,
      0.5563596070995023,
      0.0,
      0.5990899288580531,
      0.0,
      0.013775599687555292,
      0.0,
      0.5425948024022468,
      0.0,
      0.3168738243376409,
      0.2945128209063633,
      0.6908058078612046,
      0.0,
      0.18077305356858145,
      0.0,
      0.3262138537122061,
      0.0,
      0.5207874408531996,
      0.0,
      0.19657562093829006,
      0.0,
      0.5530564530298779,
      0.8432759504938689,
      0.2135217951571455,
      0.0,
      0.4938272144789949,
      0.0,
      0.73929051656544,
      0.0,
      0.0,
      0.0,
      0.0,
      0.0,
      0.006159282552603382,
      0.0,
      0.3592588934388787,
      0.0,
      0.6498489417825334,
      0.0,
      0.8540871806283924,
      0.0,
      0.3120703159988917,
      0.0,
      0.3914566244546832,
      0.0,
      0.2514812254072451,
      0.7621917244848295,
      0.5936947475099529,
      0.0,
      0.03558696585950977
     ]
    },
    {
     "axis": {
      "matches": true
     },
     "label": "Annealing (s)",
     "values": [
      0.4178738175678495,
      0.14782159786335536,
      0.6261272306843845,
      0.9134350845918594,
      0.4793631887943727,
      0.04949468919631783,
      0.6928784906906275,
      0.31743397035843424,
      0.7723036443157668,
      0.9984895274952682,
      0.2419073920289123,
      0.6191544989476855,
      0.27450136055493085,
      0.7066625707050449,
      0.3174586625582097,
      0.14391260694824035,
      0.3142722640184229,
      0.8675258361953322,
      0.3393152092049729,
      0.9017977418999991,
      0.3226039862645327,
      0.12984539222852245,
      0.3785547297581016,
      0.17029269469016928,
      0.5580000533664726,
      0.7335148326314436,
      0.3366547414177813,
      0.1359851481145994,
      0.3349126779264388,
      0.2755873003428667,
      0.3608514022933577,
      0.9754766247144109,
      0.3568890496254331,
      0.6903671987526931,
      0.3256267775304007,
      0.8208913200713579,
      0.9755637760032988,
      0.3891341826744796,
      0.3437820274203301,
      0.4718577826394457,
      0.3079411574447994,
      0.5711486030322024,
      0.3125281647962296,
      0.19640167705910366,
      0.3297928761688962,
      0.9707253146677232,
      0.3086188678343425,
      0.6569001769420901,
      0.28135553842349204,
      0.4846910922138097,
      0.34089502601483795,
      0.05804825692094717,
      0.2557781177183471,
      0.9010953203205962,
      0.301844162079232,
      0.6083095899274138,
      0.33517767477092225,
      0.63008280109059,
      0.2729636959037257,
      0.13135581265524154,
      0.90761074414506,
      0.9591480906331716,
      0.3026148632899449,
      0.4651234113210801
     ]
    },
    {
     "axis": {
      "matches": true
     },
     "label": "measurement_mean",
     "values": [
      6.427523906561943e-07,
      2.865027739604149e-07,
      3.954771209366873e-07,
      1.3896457216909153e-07,
      0.0,
      3.137901940810497e-07,
      0.0,
      7.617835111023977e-07,
      0.0,
      2.1398604670309924e-07,
      0.0,
      4.318220338342677e-07,
      7.254682742854102e-07,
      4.974283056099928e-07,
      7.861761469627684e-07,
      1.6326903772371194e-07,
      7.321412947660413e-07,
      5.433333531229525e-07,
      7.996854819999903e-07,
      5.24584303795639e-07,
      7.887154574695073e-07,
      3.622838292593817e-07,
      7.978206669487397e-07,
      3.5312300730610683e-07,
      5.340000235864424e-07,
      5.336503741224029e-07,
      7.963032600203501e-07,
      3.245632734342701e-08,
      7.96819281135191e-07,
      4.912173923923757e-07,
      8.294626239950668e-07,
      0.0,
      8.736600471657696e-07,
      6.041340155712576e-07,
      8.75164660047941e-07,
      3.8831946552169547e-07,
      4.2536103980709905e-07,
      4.2582823507991454e-07,
      8.484124161243309e-07,
      0.0,
      8.435102885675174e-07,
      7.257241641051966e-07,
      9.028369851809736e-07,
      4.469541623621504e-07,
      8.756786841855927e-07,
      6.001740623746497e-07,
      9.067031095498686e-07,
      1.7950744129081087e-07,
      8.79243869028804e-07,
      6.720654635326323e-07,
      8.491575704205808e-07,
      4.6933111036499395e-07,
      8.490288985803906e-07,
      5.856216787722522e-08,
      8.631087773083023e-07,
      8.111973322955272e-07,
      8.463376298991718e-07,
      4.379605732433134e-07,
      8.525157940927304e-07,
      4.0152700167640403e-07,
      4.467536199266512e-07,
      7.170390398004252e-07,
      8.574313748540068e-07,
      3.921922197597749e-07
     ]
    }
   ],
   "hoverlabel": {
    "namelength": 0
   },
   "hovertemplate": "%{xaxis.title.text}=%{x}<br>%{yaxis.title.text}=%{y}<br>measurement_mean=%{marker.color}",
   "legendgroup": "",
   "marker": {
    "color": [
     6.427523906561943e-07,
     2.865027739604149e-07,
     3.954771209366873e-07,
     1.3896457216909153e-07,
     0.0,
     3.137901940810497e-07,
     0.0,
     7.617835111023977e-07,
     0.0,
     2.1398604670309924e-07,
     0.0,
     4.318220338342677e-07,
     7.254682742854102e-07,
     4.974283056099928e-07,
     7.861761469627684e-07,
     1.6326903772371194e-07,
     7.321412947660413e-07,
     5.433333531229525e-07,
     7.996854819999903e-07,
     5.24584303795639e-07,
     7.887154574695073e-07,
     3.622838292593817e-07,
     7.978206669487397e-07,
     3.5312300730610683e-07,
     5.340000235864424e-07,
     5.336503741224029e-07,
     7.963032600203501e-07,
     3.245632734342701e-08,
     7.96819281135191e-07,
     4.912173923923757e-07,
     8.294626239950668e-07,
     0.0,
     8.736600471657696e-07,
     6.041340155712576e-07,
     8.75164660047941e-07,
     3.8831946552169547e-07,
     4.2536103980709905e-07,
     4.2582823507991454e-07,
     8.484124161243309e-07,
     0.0,
     8.435102885675174e-07,
     7.257241641051966e-07,
     9.028369851809736e-07,
     4.469541623621504e-07,
     8.756786841855927e-07,
     6.001740623746497e-07,
     9.067031095498686e-07,
     1.7950744129081087e-07,
     8.79243869028804e-07,
     6.720654635326323e-07,
     8.491575704205808e-07,
     4.6933111036499395e-07,
     8.490288985803906e-07,
     5.856216787722522e-08,
     8.631087773083023e-07,
     8.111973322955272e-07,
     8.463376298991718e-07,
     4.379605732433134e-07,
     8.525157940927304e-07,
     4.0152700167640403e-07,
     4.467536199266512e-07,
     7.170390398004252e-07,
     8.574313748540068e-07,
     3.921922197597749e-07
    ],
    "coloraxis": "coloraxis",
    "symbol": "circle",
    "line": {
     "color": "white",
     "width": 0.5
    },
    "size": 10
   },
   "name": "",
   "showlegend": false,
   "type": "splom",
   "diagonal": {
    "visible": false
   },
   "showupperhalf": false
  }
 ],
 "layout": {
  "template": {
   "data": {
    "barpolar": [
     {
      "marker": {
       "line": {
        "color": "#E5ECF6",
        "width": 0.5
       }
      },
      "type": "barpolar"
     }
    ],
    "bar": [
     {
      "error_x": {
       "color": "#2a3f5f"
      },
      "error_y": {
       "color": "#2a3f5f"
      },
      "marker": {
       "line": {
        "color": "#E5ECF6",
        "width": 0.5
       }
      },
      "type": "bar"
     }
    ],
    "carpet": [
     {
      "aaxis": {
       "endlinecolor": "#2a3f5f",
       "gridcolor": "white",
       "linecolor": "white",
       "minorgridcolor": "white",
       "startlinecolor": "#2a3f5f"
      },
      "baxis": {
       "endlinecolor": "#2a3f5f",
       "gridcolor": "white",
       "linecolor": "white",
       "minorgridcolor": "white",
       "startlinecolor": "#2a3f5f"
      },
      "type": "carpet"
     }
    ],
    "choropleth": [
     {
      "colorbar": {
       "outlinewidth": 0,
       "ticks": ""
      },
      "type": "choropleth"
     }
    ],
    "contourcarpet": [
     {
      "colorbar": {
       "outlinewidth": 0,
       "ticks": ""
      },
      "type": "contourcarpet"
     }
    ],
    "contour": [
     {
      "colorbar": {
       "outlinewidth": 0,
       "ticks": ""
      },
      "colorscale": [
       [
        0.0,
        "#0d0887"
       ],
       [
        0.1111111111111111,
        "#46039f"
       ],
       [
        0.2222222222222222,
        "#7201a8"
       ],
       [
        0.3333333333333333,
        "#9c179e"
       ],
       [
        0.4444444444444444,
        "#bd3786"
       ],
       [
        0.5555555555555556,
        "#d8576b"
       ],
       [
        0.6666666666666666,
        "#ed7953"
       ],
       [
        0.7777777777777778,
        "#fb9f3a"
       ],
       [
        0.8888888888888888,
        "#fdca26"
       ],
       [
        1.0,
        "#f0f921"
       ]
      ],
      "type": "contour"
     }
    ],
    "heatmapgl": [
     {
      "colorbar": {
       "outlinewidth": 0,
       "ticks": ""
      },
      "colorscale": [
       [
        0.0,
        "#0d0887"
       ],
       [
        0.1111111111111111,
        "#46039f"
       ],
       [
        0.2222222222222222,
        "#7201a8"
       ],
       [
        0.3333333333333333,
        "#9c179e"
       ],
       [
        0.4444444444444444,
        "#bd3786"
       ],
       [
        0.5555555555555556,
        "#d8576b"
       ],
       [
        0.6666666666666666,
        "#ed7953"
       ],
       [
        0.7777777777777778,
        "#fb9f3a"
       ],
       [
        0.8888888888888888,
        "#fdca26"
       ],
       [
        1.0,
        "#f0f921"
       ]
      ],
      "type": "heatmapgl"
     }
    ],
    "heatmap": [
     {
      "colorbar": {
       "outlinewidth": 0,
       "ticks": ""
      },
      "colorscale": [
       [
        0.0,
        "#0d0887"
       ],
       [
        0.1111111111111111,
        "#46039f"
       ],
       [
        0.2222222222222222,
        "#7201a8"
       ],
       [
        0.3333333333333333,
        "#9c179e"
       ],
       [
        0.4444444444444444,
        "#bd3786"
       ],
       [
        0.5555555555555556,
        "#d8576b"
       ],
       [
        0.6666666666666666,
        "#ed7953"
       ],
       [
        0.7777777777777778,
        "#fb9f3a"
       ],
       [
        0.8888888888888888,
        "#fdca26"
       ],
       [
        1.0,
        "#f0f921"
       ]
      ],
      "type": "heatmap"
     }
    ],
    "histogram2dcontour": [
     {
      "colorbar": {
       "outlinewidth": 0,
       "ticks": ""
      },
      "colorscale": [
       [
        0.0,
        "#0d0887"
       ],
       [
        0.1111111111111111,
        "#46039f"
       ],
       [
        0.2222222222222222,
        "#7201a8"
       ],
       [
        0.3333333333333333,
        "#9c179e"
       ],
       [
        0.4444444444444444,
        "#bd3786"
       ],
       [
        0.5555555555555556,
        "#d8576b"
       ],
       [
        0.6666666666666666,
        "#ed7953"
       ],
       [
        0.7777777777777778,
        "#fb9f3a"
       ],
       [
        0.8888888888888888,
        "#fdca26"
       ],
       [
        1.0,
        "#f0f921"
       ]
      ],
      "type": "histogram2dcontour"
     }
    ],
    "histogram2d": [
     {
      "colorbar": {
       "outlinewidth": 0,
       "ticks": ""
      },
      "colorscale": [
       [
        0.0,
        "#0d0887"
       ],
       [
        0.1111111111111111,
        "#46039f"
       ],
       [
        0.2222222222222222,
        "#7201a8"
       ],
       [
        0.3333333333333333,
        "#9c179e"
       ],
       [
        0.4444444444444444,
        "#bd3786"
       ],
       [
        0.5555555555555556,
        "#d8576b"
       ],
       [
        0.6666666666666666,
        "#ed7953"
       ],
       [
        0.7777777777777778,
        "#fb9f3a"
       ],
       [
        0.8888888888888888,
        "#fdca26"
       ],
       [
        1.0,
        "#f0f921"
       ]
      ],
      "type": "histogram2d"
     }
    ],
    "histogram": [
     {
      "marker": {
       "colorbar": {
        "outlinewidth": 0,
        "ticks": ""
       }
      },
      "type": "histogram"
     }
    ],
    "mesh3d": [
     {
      "colorbar": {
       "outlinewidth": 0,
       "ticks": ""
      },
      "type": "mesh3d"
     }
    ],
    "parcoords": [
     {
      "line": {
       "colorbar": {
        "outlinewidth": 0,
        "ticks": ""
       }
      },
      "type": "parcoords"
     }
    ],
    "scatter3d": [
     {
      "line": {
       "colorbar": {
        "outlinewidth": 0,
        "ticks": ""
       }
      },
      "marker": {
       "colorbar": {
        "outlinewidth": 0,
        "ticks": ""
       }
      },
      "type": "scatter3d"
     }
    ],
    "scattercarpet": [
     {
      "marker": {
       "colorbar": {
        "outlinewidth": 0,
        "ticks": ""
       }
      },
      "type": "scattercarpet"
     }
    ],
    "scattergeo": [
     {
      "marker": {
       "colorbar": {
        "outlinewidth": 0,
        "ticks": ""
       }
      },
      "type": "scattergeo"
     }
    ],
    "scattergl": [
     {
      "marker": {
       "colorbar": {
        "outlinewidth": 0,
        "ticks": ""
       }
      },
      "type": "scattergl"
     }
    ],
    "scattermapbox": [
     {
      "marker": {
       "colorbar": {
        "outlinewidth": 0,
        "ticks": ""
       }
      },
      "type": "scattermapbox"
     }
    ],
    "scatterpolargl": [
     {
      "marker": {
       "colorbar": {
        "outlinewidth": 0,
        "ticks": ""
       }
      },
      "type": "scatterpolargl"
     }
    ],
    "scatterpolar": [
     {
      "marker": {
       "colorbar": {
        "outlinewidth": 0,
        "ticks": ""
       }
      },
      "type": "scatterpolar"
     }
    ],
    "scatter": [
     {
      "marker": {
       "colorbar": {
        "outlinewidth": 0,
        "ticks": ""
       }
      },
      "type": "scatter"
     }
    ],
    "scatterternary": [
     {
      "marker": {
       "colorbar": {
        "outlinewidth": 0,
        "ticks": ""
       }
      },
      "type": "scatterternary"
     }
    ],
    "surface": [
     {
      "colorbar": {
       "outlinewidth": 0,
       "ticks": ""
      },
      "colorscale": [
       [
        0.0,
        "#0d0887"
       ],
       [
        0.1111111111111111,
        "#46039f"
       ],
       [
        0.2222222222222222,
        "#7201a8"
       ],
       [
        0.3333333333333333,
        "#9c179e"
       ],
       [
        0.4444444444444444,
        "#bd3786"
       ],
       [
        0.5555555555555556,
        "#d8576b"
       ],
       [
        0.6666666666666666,
        "#ed7953"
       ],
       [
        0.7777777777777778,
        "#fb9f3a"
       ],
       [
        0.8888888888888888,
        "#fdca26"
       ],
       [
        1.0,
        "#f0f921"
       ]
      ],
      "type": "surface"
     }
    ],
    "table": [
     {
      "cells": {
       "fill": {
        "color": "#EBF0F8"
       },
       "line": {
        "color": "white"
       }
      },
      "header": {
       "fill": {
        "color": "#C8D4E3"
       },
       "line": {
        "color": "white"
       }
      },
      "type": "table"
     }
    ]
   },
   "layout": {
    "annotationdefaults": {
     "arrowcolor": "#2a3f5f",
     "arrowhead": 0,
     "arrowwidth": 1
    },
    "colorscale": {
     "diverging": [
      [
       0,
       "#8e0152"
      ],
      [
       0.1,
       "#c51b7d"
      ],
      [
       0.2,
       "#de77ae"
      ],
      [
       0.3,
       "#f1b6da"
      ],
      [
       0.4,
       "#fde0ef"
      ],
      [
       0.5,
       "#f7f7f7"
      ],
      [
       0.6,
       "#e6f5d0"
      ],
      [
       0.7,
       "#b8e186"
      ],
      [
       0.8,
       "#7fbc41"
      ],
      [
       0.9,
       "#4d9221"
      ],
      [
       1,
       "#276419"
      ]
     ],
     "sequential": [
      [
       0.0,
       "#0d0887"
      ],
      [
       0.1111111111111111,
       "#46039f"
      ],
      [
       0.2222222222222222,
       "#7201a8"
      ],
      [
       0.3333333333333333,
       "#9c179e"
      ],
      [
       0.4444444444444444,
       "#bd3786"
      ],
      [
       0.5555555555555556,
       "#d8576b"
      ],
      [
       0.6666666666666666,
       "#ed7953"
      ],
      [
       0.7777777777777778,
       "#fb9f3a"
      ],
      [
       0.8888888888888888,
       "#fdca26"
      ],
      [
       1.0,
       "#f0f921"
      ]
     ],
     "sequentialminus": [
      [
       0.0,
       "#0d0887"
      ],
      [
       0.1111111111111111,
       "#46039f"
      ],
      [
       0.2222222222222222,
       "#7201a8"
      ],
      [
       0.3333333333333333,
       "#9c179e"
      ],
      [
       0.4444444444444444,
       "#bd3786"
      ],
      [
       0.5555555555555556,
       "#d8576b"
      ],
      [
       0.6666666666666666,
       "#ed7953"
      ],
      [
       0.7777777777777778,
       "#fb9f3a"
      ],
      [
       0.8888888888888888,
       "#fdca26"
      ],
      [
       1.0,
       "#f0f921"
      ]
     ]
    },
    "colorway": [
     "#636efa",
     "#EF553B",
     "#00cc96",
     "#ab63fa",
     "#FFA15A",
     "#19d3f3",
     "#FF6692",
     "#B6E880",
     "#FF97FF",
     "#FECB52"
    ],
    "font": {
     "color": "#2a3f5f"
    },
    "geo": {
     "bgcolor": "white",
     "lakecolor": "white",
     "landcolor": "#E5ECF6",
     "showlakes": true,
     "showland": true,
     "subunitcolor": "white"
    },
    "hoverlabel": {
     "align": "left"
    },
    "hovermode": "closest",
    "mapbox": {
     "style": "light"
    },
    "paper_bgcolor": "white",
    "plot_bgcolor": "#E5ECF6",
    "polar": {
     "angularaxis": {
      "gridcolor": "white",
      "linecolor": "white",
      "ticks": ""
     },
     "bgcolor": "#E5ECF6",
     "radialaxis": {
      "gridcolor": "white",
      "linecolor": "white",
      "ticks": ""
     }
    },
    "scene": {
     "xaxis": {
      "backgroundcolor": "#E5ECF6",
      "gridcolor": "white",
      "gridwidth": 2,
      "linecolor": "white",
      "showbackground": true,
      "ticks": "",
      "zerolinecolor": "white"
     },
     "yaxis": {
      "backgroundcolor": "#E5ECF6",
      "gridcolor": "white",
      "gridwidth": 2,
      "linecolor": "white",
      "showbackground": true,
      "ticks": "",
      "zerolinecolor": "white"
     },
     "zaxis": {
      "backgroundcolor": "#E5ECF6",
      "gridcolor": "white",
      "gridwidth": 2,
      "linecolor": "white",
      "showbackground": true,
      "ticks": "",
      "zerolinecolor": "white"
     }
    },
    "shapedefaults": {
     "line": {
      "color": "#2a3f5f"
     }
    },
    "ternary": {
     "aaxis": {
      "gridcolor": "white",
      "linecolor": "white",
      "ticks": ""
     },
     "baxis": {
      "gridcolor": "white",
      "linecolor": "white",
      "ticks": ""
     },
     "bgcolor": "#E5ECF6",
     "caxis": {
      "gridcolor": "white",
      "linecolor": "white",
      "ticks": ""
     }
    },
    "title": {
     "x": 0.05
    },
    "xaxis": {
     "automargin": true,
     "gridcolor": "white",
     "linecolor": "white",
     "ticks": "",
     "zerolinecolor": "white",
     "zerolinewidth": 2
    },
    "yaxis": {
     "automargin": true,
     "gridcolor": "white",
     "linecolor": "white",
     "ticks": "",
     "zerolinecolor": "white",
     "zerolinewidth": 2
    }
   }
  },
  "coloraxis": {
   "colorscale": [
    [
     0.0,
     "#440154"
    ],
    [
     0.1111111111111111,
     "#482878"
    ],
    [
     0.2222222222222222,
     "#3e4989"
    ],
    [
     0.3333333333333333,
     "#31688e"
    ],
    [
     0.4444444444444444,
     "#26828e"
    ],
    [
     0.5555555555555556,
     "#1f9e89"
    ],
    [
     0.6666666666666666,
     "#35b779"
    ],
    [
     0.7777777777777778,
     "#6ece58"
    ],
    [
     0.8888888888888888,
     "#b5de2b"
    ],
    [
     1.0,
     "#fde725"
    ]
   ],
   "colorbar": {
    "title": {
     "text": "measurement_mean"
    }
   }
  },
  "legend": {
   "tracegroupgap": 0
  },
  "margin": {
   "t": 60
  },
  "dragmode": "select",
  "height": 950,
  "hovermode": "closest",
  "title": {
   "text": "Optimizer Parameters: 2019-10-31_15-28-55, Realised Parameters Corner Plot"
  }
 }
}

Hum this is very weird. Since I can see that you save all the figures as html files, can you check that each html figure looks ok (in which case it’s a Dash problem, otherwise it might be a plotly.js problem) ?

Yeah, so I think the issue must be with the dcc.graph component and how it renders these JSON files. The issue is caused when switching between the JSON noted above, and this JSON.

{
 "data": [
  {
   "dimensions": [
    {
     "axis": {
      "matches": true
     },
     "label": "sample",
     "values": [
      0,
      1,
      2,
      3,
      4,
      5,
      6,
      7,
      8,
      9,
      10,
      11,
      12,
      13,
      14,
      15,
      16,
      17,
      18,
      19
     ]
    },
    {
     "axis": {
      "matches": true
     },
     "label": "Zn / HTM",
     "values": [
      0.5645951797621754,
      0.4576330640792163,
      0.2979852587402558,
      0.1684921989190987,
      0.09721769066401198,
      0.9543396289453736,
      0.097849866769543,
      0.8867926690395149,
      0.19757541924095165,
      0.2235292995886101,
      0.13026760718302954,
      0.9108506786379166,
      0.09507041069823437,
      0.1935169955862569,
      0.1257196612296184,
      0.6138982505862232,
      0.09133015730891472,
      0.953458699051334,
      0.11800003290849966,
      0.5211192471566792
     ]
    },
    {
     "axis": {
      "matches": true
     },
     "label": "tBP / Zn",
     "values": [
      4.672208310987012,
      1.4040459530332603,
      3.6496833534066915,
      5.078425375104916,
      5.229122495350613,
      3.361458394043272,
      5.736847342259754,
      0.21517710759056585,
      5.02122611581853,
      2.324513605559357,
      5.08833416443926,
      1.8192046280909984,
      5.154274938488367,
      0.0,
      4.284037794105632,
      2.846583790463592,
      5.444066209782507,
      4.666805699635848,
      4.9377448355850575,
      0.4933134429576378
     ]
    },
    {
     "axis": {
      "matches": true
     },
     "label": "quality_score",
     "values": [
      0.998992144737555,
      0.97991797765312,
      0.986090213060379,
      0.79137344342535,
      0.144856426252417,
      0.9980768768683721,
      0.764619590795558,
      0.9925829233682671,
      0.848657441163517,
      0.8854797073113531,
      0.456306450089197,
      0.962596446275711,
      0.17748756690011602,
      0.969048792739277,
      0.247596107563763,
      0.998984563933766,
      0.147149343161246,
      0.9950994560899941,
      0.30736919482360103,
      0.991067083957403
     ]
    }
   ],
   "hoverlabel": {
    "namelength": 0
   },
   "hovertemplate": "%{xaxis.title.text}=%{x}<br>%{yaxis.title.text}=%{y}<br>quality_score=%{marker.color}",
   "legendgroup": "",
   "marker": {
    "color": [
     0.998992144737555,
     0.97991797765312,
     0.986090213060379,
     0.79137344342535,
     0.144856426252417,
     0.9980768768683721,
     0.764619590795558,
     0.9925829233682671,
     0.848657441163517,
     0.8854797073113531,
     0.456306450089197,
     0.962596446275711,
     0.17748756690011602,
     0.969048792739277,
     0.247596107563763,
     0.998984563933766,
     0.147149343161246,
     0.9950994560899941,
     0.30736919482360103,
     0.991067083957403
    ],
    "coloraxis": "coloraxis",
    "symbol": "circle",
    "line": {
     "color": "white",
     "width": 0.5
    },
    "size": 10
   },
   "name": "",
   "showlegend": false,
   "type": "splom",
   "diagonal": {
    "visible": false
   },
   "showupperhalf": false
  }
 ],
 "layout": {
  "template": {
   "data": {
    "barpolar": [
     {
      "marker": {
       "line": {
        "color": "#E5ECF6",
        "width": 0.5
       }
      },
      "type": "barpolar"
     }
    ],
    "bar": [
     {
      "error_x": {
       "color": "#2a3f5f"
      },
      "error_y": {
       "color": "#2a3f5f"
      },
      "marker": {
       "line": {
        "color": "#E5ECF6",
        "width": 0.5
       }
      },
      "type": "bar"
     }
    ],
    "carpet": [
     {
      "aaxis": {
       "endlinecolor": "#2a3f5f",
       "gridcolor": "white",
       "linecolor": "white",
       "minorgridcolor": "white",
       "startlinecolor": "#2a3f5f"
      },
      "baxis": {
       "endlinecolor": "#2a3f5f",
       "gridcolor": "white",
       "linecolor": "white",
       "minorgridcolor": "white",
       "startlinecolor": "#2a3f5f"
      },
      "type": "carpet"
     }
    ],
    "choropleth": [
     {
      "colorbar": {
       "outlinewidth": 0,
       "ticks": ""
      },
      "type": "choropleth"
     }
    ],
    "contourcarpet": [
     {
      "colorbar": {
       "outlinewidth": 0,
       "ticks": ""
      },
      "type": "contourcarpet"
     }
    ],
    "contour": [
     {
      "colorbar": {
       "outlinewidth": 0,
       "ticks": ""
      },
      "colorscale": [
       [
        0.0,
        "#0d0887"
       ],
       [
        0.1111111111111111,
        "#46039f"
       ],
       [
        0.2222222222222222,
        "#7201a8"
       ],
       [
        0.3333333333333333,
        "#9c179e"
       ],
       [
        0.4444444444444444,
        "#bd3786"
       ],
       [
        0.5555555555555556,
        "#d8576b"
       ],
       [
        0.6666666666666666,
        "#ed7953"
       ],
       [
        0.7777777777777778,
        "#fb9f3a"
       ],
       [
        0.8888888888888888,
        "#fdca26"
       ],
       [
        1.0,
        "#f0f921"
       ]
      ],
      "type": "contour"
     }
    ],
    "heatmapgl": [
     {
      "colorbar": {
       "outlinewidth": 0,
       "ticks": ""
      },
      "colorscale": [
       [
        0.0,
        "#0d0887"
       ],
       [
        0.1111111111111111,
        "#46039f"
       ],
       [
        0.2222222222222222,
        "#7201a8"
       ],
       [
        0.3333333333333333,
        "#9c179e"
       ],
       [
        0.4444444444444444,
        "#bd3786"
       ],
       [
        0.5555555555555556,
        "#d8576b"
       ],
       [
        0.6666666666666666,
        "#ed7953"
       ],
       [
        0.7777777777777778,
        "#fb9f3a"
       ],
       [
        0.8888888888888888,
        "#fdca26"
       ],
       [
        1.0,
        "#f0f921"
       ]
      ],
      "type": "heatmapgl"
     }
    ],
    "heatmap": [
     {
      "colorbar": {
       "outlinewidth": 0,
       "ticks": ""
      },
      "colorscale": [
       [
        0.0,
        "#0d0887"
       ],
       [
        0.1111111111111111,
        "#46039f"
       ],
       [
        0.2222222222222222,
        "#7201a8"
       ],
       [
        0.3333333333333333,
        "#9c179e"
       ],
       [
        0.4444444444444444,
        "#bd3786"
       ],
       [
        0.5555555555555556,
        "#d8576b"
       ],
       [
        0.6666666666666666,
        "#ed7953"
       ],
       [
        0.7777777777777778,
        "#fb9f3a"
       ],
       [
        0.8888888888888888,
        "#fdca26"
       ],
       [
        1.0,
        "#f0f921"
       ]
      ],
      "type": "heatmap"
     }
    ],
    "histogram2dcontour": [
     {
      "colorbar": {
       "outlinewidth": 0,
       "ticks": ""
      },
      "colorscale": [
       [
        0.0,
        "#0d0887"
       ],
       [
        0.1111111111111111,
        "#46039f"
       ],
       [
        0.2222222222222222,
        "#7201a8"
       ],
       [
        0.3333333333333333,
        "#9c179e"
       ],
       [
        0.4444444444444444,
        "#bd3786"
       ],
       [
        0.5555555555555556,
        "#d8576b"
       ],
       [
        0.6666666666666666,
        "#ed7953"
       ],
       [
        0.7777777777777778,
        "#fb9f3a"
       ],
       [
        0.8888888888888888,
        "#fdca26"
       ],
       [
        1.0,
        "#f0f921"
       ]
      ],
      "type": "histogram2dcontour"
     }
    ],
    "histogram2d": [
     {
      "colorbar": {
       "outlinewidth": 0,
       "ticks": ""
      },
      "colorscale": [
       [
        0.0,
        "#0d0887"
       ],
       [
        0.1111111111111111,
        "#46039f"
       ],
       [
        0.2222222222222222,
        "#7201a8"
       ],
       [
        0.3333333333333333,
        "#9c179e"
       ],
       [
        0.4444444444444444,
        "#bd3786"
       ],
       [
        0.5555555555555556,
        "#d8576b"
       ],
       [
        0.6666666666666666,
        "#ed7953"
       ],
       [
        0.7777777777777778,
        "#fb9f3a"
       ],
       [
        0.8888888888888888,
        "#fdca26"
       ],
       [
        1.0,
        "#f0f921"
       ]
      ],
      "type": "histogram2d"
     }
    ],
    "histogram": [
     {
      "marker": {
       "colorbar": {
        "outlinewidth": 0,
        "ticks": ""
       }
      },
      "type": "histogram"
     }
    ],
    "mesh3d": [
     {
      "colorbar": {
       "outlinewidth": 0,
       "ticks": ""
      },
      "type": "mesh3d"
     }
    ],
    "parcoords": [
     {
      "line": {
       "colorbar": {
        "outlinewidth": 0,
        "ticks": ""
       }
      },
      "type": "parcoords"
     }
    ],
    "scatter3d": [
     {
      "line": {
       "colorbar": {
        "outlinewidth": 0,
        "ticks": ""
       }
      },
      "marker": {
       "colorbar": {
        "outlinewidth": 0,
        "ticks": ""
       }
      },
      "type": "scatter3d"
     }
    ],
    "scattercarpet": [
     {
      "marker": {
       "colorbar": {
        "outlinewidth": 0,
        "ticks": ""
       }
      },
      "type": "scattercarpet"
     }
    ],
    "scattergeo": [
     {
      "marker": {
       "colorbar": {
        "outlinewidth": 0,
        "ticks": ""
       }
      },
      "type": "scattergeo"
     }
    ],
    "scattergl": [
     {
      "marker": {
       "colorbar": {
        "outlinewidth": 0,
        "ticks": ""
       }
      },
      "type": "scattergl"
     }
    ],
    "scattermapbox": [
     {
      "marker": {
       "colorbar": {
        "outlinewidth": 0,
        "ticks": ""
       }
      },
      "type": "scattermapbox"
     }
    ],
    "scatterpolargl": [
     {
      "marker": {
       "colorbar": {
        "outlinewidth": 0,
        "ticks": ""
       }
      },
      "type": "scatterpolargl"
     }
    ],
    "scatterpolar": [
     {
      "marker": {
       "colorbar": {
        "outlinewidth": 0,
        "ticks": ""
       }
      },
      "type": "scatterpolar"
     }
    ],
    "scatter": [
     {
      "marker": {
       "colorbar": {
        "outlinewidth": 0,
        "ticks": ""
       }
      },
      "type": "scatter"
     }
    ],
    "scatterternary": [
     {
      "marker": {
       "colorbar": {
        "outlinewidth": 0,
        "ticks": ""
       }
      },
      "type": "scatterternary"
     }
    ],
    "surface": [
     {
      "colorbar": {
       "outlinewidth": 0,
       "ticks": ""
      },
      "colorscale": [
       [
        0.0,
        "#0d0887"
       ],
       [
        0.1111111111111111,
        "#46039f"
       ],
       [
        0.2222222222222222,
        "#7201a8"
       ],
       [
        0.3333333333333333,
        "#9c179e"
       ],
       [
        0.4444444444444444,
        "#bd3786"
       ],
       [
        0.5555555555555556,
        "#d8576b"
       ],
       [
        0.6666666666666666,
        "#ed7953"
       ],
       [
        0.7777777777777778,
        "#fb9f3a"
       ],
       [
        0.8888888888888888,
        "#fdca26"
       ],
       [
        1.0,
        "#f0f921"
       ]
      ],
      "type": "surface"
     }
    ],
    "table": [
     {
      "cells": {
       "fill": {
        "color": "#EBF0F8"
       },
       "line": {
        "color": "white"
       }
      },
      "header": {
       "fill": {
        "color": "#C8D4E3"
       },
       "line": {
        "color": "white"
       }
      },
      "type": "table"
     }
    ]
   },
   "layout": {
    "annotationdefaults": {
     "arrowcolor": "#2a3f5f",
     "arrowhead": 0,
     "arrowwidth": 1
    },
    "colorscale": {
     "diverging": [
      [
       0,
       "#8e0152"
      ],
      [
       0.1,
       "#c51b7d"
      ],
      [
       0.2,
       "#de77ae"
      ],
      [
       0.3,
       "#f1b6da"
      ],
      [
       0.4,
       "#fde0ef"
      ],
      [
       0.5,
       "#f7f7f7"
      ],
      [
       0.6,
       "#e6f5d0"
      ],
      [
       0.7,
       "#b8e186"
      ],
      [
       0.8,
       "#7fbc41"
      ],
      [
       0.9,
       "#4d9221"
      ],
      [
       1,
       "#276419"
      ]
     ],
     "sequential": [
      [
       0.0,
       "#0d0887"
      ],
      [
       0.1111111111111111,
       "#46039f"
      ],
      [
       0.2222222222222222,
       "#7201a8"
      ],
      [
       0.3333333333333333,
       "#9c179e"
      ],
      [
       0.4444444444444444,
       "#bd3786"
      ],
      [
       0.5555555555555556,
       "#d8576b"
      ],
      [
       0.6666666666666666,
       "#ed7953"
      ],
      [
       0.7777777777777778,
       "#fb9f3a"
      ],
      [
       0.8888888888888888,
       "#fdca26"
      ],
      [
       1.0,
       "#f0f921"
      ]
     ],
     "sequentialminus": [
      [
       0.0,
       "#0d0887"
      ],
      [
       0.1111111111111111,
       "#46039f"
      ],
      [
       0.2222222222222222,
       "#7201a8"
      ],
      [
       0.3333333333333333,
       "#9c179e"
      ],
      [
       0.4444444444444444,
       "#bd3786"
      ],
      [
       0.5555555555555556,
       "#d8576b"
      ],
      [
       0.6666666666666666,
       "#ed7953"
      ],
      [
       0.7777777777777778,
       "#fb9f3a"
      ],
      [
       0.8888888888888888,
       "#fdca26"
      ],
      [
       1.0,
       "#f0f921"
      ]
     ]
    },
    "colorway": [
     "#636efa",
     "#EF553B",
     "#00cc96",
     "#ab63fa",
     "#FFA15A",
     "#19d3f3",
     "#FF6692",
     "#B6E880",
     "#FF97FF",
     "#FECB52"
    ],
    "font": {
     "color": "#2a3f5f"
    },
    "geo": {
     "bgcolor": "white",
     "lakecolor": "white",
     "landcolor": "#E5ECF6",
     "showlakes": true,
     "showland": true,
     "subunitcolor": "white"
    },
    "hoverlabel": {
     "align": "left"
    },
    "hovermode": "closest",
    "mapbox": {
     "style": "light"
    },
    "paper_bgcolor": "white",
    "plot_bgcolor": "#E5ECF6",
    "polar": {
     "angularaxis": {
      "gridcolor": "white",
      "linecolor": "white",
      "ticks": ""
     },
     "bgcolor": "#E5ECF6",
     "radialaxis": {
      "gridcolor": "white",
      "linecolor": "white",
      "ticks": ""
     }
    },
    "scene": {
     "xaxis": {
      "backgroundcolor": "#E5ECF6",
      "gridcolor": "white",
      "gridwidth": 2,
      "linecolor": "white",
      "showbackground": true,
      "ticks": "",
      "zerolinecolor": "white"
     },
     "yaxis": {
      "backgroundcolor": "#E5ECF6",
      "gridcolor": "white",
      "gridwidth": 2,
      "linecolor": "white",
      "showbackground": true,
      "ticks": "",
      "zerolinecolor": "white"
     },
     "zaxis": {
      "backgroundcolor": "#E5ECF6",
      "gridcolor": "white",
      "gridwidth": 2,
      "linecolor": "white",
      "showbackground": true,
      "ticks": "",
      "zerolinecolor": "white"
     }
    },
    "shapedefaults": {
     "line": {
      "color": "#2a3f5f"
     }
    },
    "ternary": {
     "aaxis": {
      "gridcolor": "white",
      "linecolor": "white",
      "ticks": ""
     },
     "baxis": {
      "gridcolor": "white",
      "linecolor": "white",
      "ticks": ""
     },
     "bgcolor": "#E5ECF6",
     "caxis": {
      "gridcolor": "white",
      "linecolor": "white",
      "ticks": ""
     }
    },
    "title": {
     "x": 0.05
    },
    "xaxis": {
     "automargin": true,
     "gridcolor": "white",
     "linecolor": "white",
     "ticks": "",
     "zerolinecolor": "white",
     "zerolinewidth": 2
    },
    "yaxis": {
     "automargin": true,
     "gridcolor": "white",
     "linecolor": "white",
     "ticks": "",
     "zerolinecolor": "white",
     "zerolinewidth": 2
    }
   }
  },
  "coloraxis": {
   "colorscale": [
    [
     0.0,
     "#440154"
    ],
    [
     0.1111111111111111,
     "#482878"
    ],
    [
     0.2222222222222222,
     "#3e4989"
    ],
    [
     0.3333333333333333,
     "#31688e"
    ],
    [
     0.4444444444444444,
     "#26828e"
    ],
    [
     0.5555555555555556,
     "#1f9e89"
    ],
    [
     0.6666666666666666,
     "#35b779"
    ],
    [
     0.7777777777777778,
     "#6ece58"
    ],
    [
     0.8888888888888888,
     "#b5de2b"
    ],
    [
     1.0,
     "#fde725"
    ]
   ],
   "colorbar": {
    "title": {
     "text": "quality_score"
    }
   }
  },
  "legend": {
   "tracegroupgap": 0
  },
  "margin": {
   "t": 60
  },
  "dragmode": "select",
  "height": 950,
  "hovermode": "closest",
  "title": {
   "text": "Optimizer Parameters: 2019-11-08_14-02-15, Realised Parameters Corner Plot"
  }
 }
}

Here is a video I made showing the isssue:

Sounds like a bug indeed. Could you try to pass the returned data as a go.Figure instead of a dict? Indeed go.Figure does some additional validation, maybe it can help. Just do

import plotly.graph_objects as go

and

return go.Figure(data)

(you may want to call the figure something else than data since data is the key for the trace in the figure object, but I don’t think it’s important).

Unfortunately return go.Figure(data) didn’t work. Thanks for your help though Emmanuelle.

OK. I’ll try to reproduce the issue with small dummy data, and if I can I’ll open an issue in Dash. Of course if you find the time to write this minimal example it would save me a very precious time, but otherwise I’ll try next week. Thanks for your help in diagnosing - including a video!

Hi Emmanuelle, I’ve managed to recreate the bug in a simple barebones example. I’ve pushed this example to a github repo, here : https://github.com/TedHaley/bugs

Thanks again for your help!

Thanks a lot, I opened https://github.com/plotly/dash-core-components/issues/702 in the dcc repo.