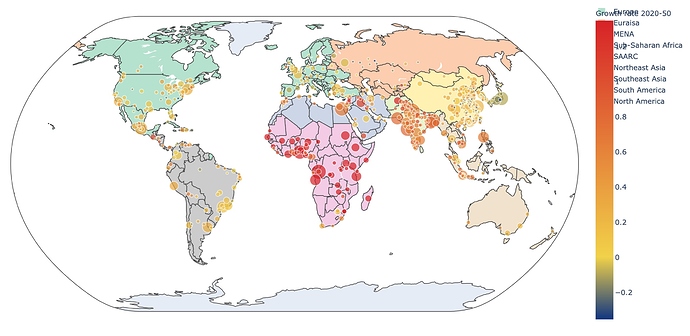
I am trying to remove the legend of trace0 in this code (last line), but it’s not happening. Any ideas?
Thank you!
import plotly.express as px
import plotly.graph_objects as go
import pandas as pd

df1 = pd.read_csv(...)
df2 = pd.read_csv(...)

fig = px.scatter_geo(df2, lon="Longitude",
                     lat="Latitude",
                     size="Pop2050",
                     color="Growth rate 2020-50",
                     color_continuous_scale=[
                         [0.0, "rgb(12,51,131)"], [0.21, "rgb(242,211,56)"], [1.0, "rgb(217,30,30)"]],
                     range_color=(-.35, 1.35),
                     color_continuous_midpoint=0,
                     projection="natural earth",
                     )

trace0 = px.choropleth(df1, color="Region",
                       locations="Code",
                       color_discrete_sequence=px.colors.qualitative.Pastel2,
                       projection="natural earth",
                       # marker=dict(opacity=0.1)
                       )

for x in range(9):
    fig.add_trace(trace0.data[x])
trace0.layout.update(showlegend=False)

fig.show()
