Figured it out ,
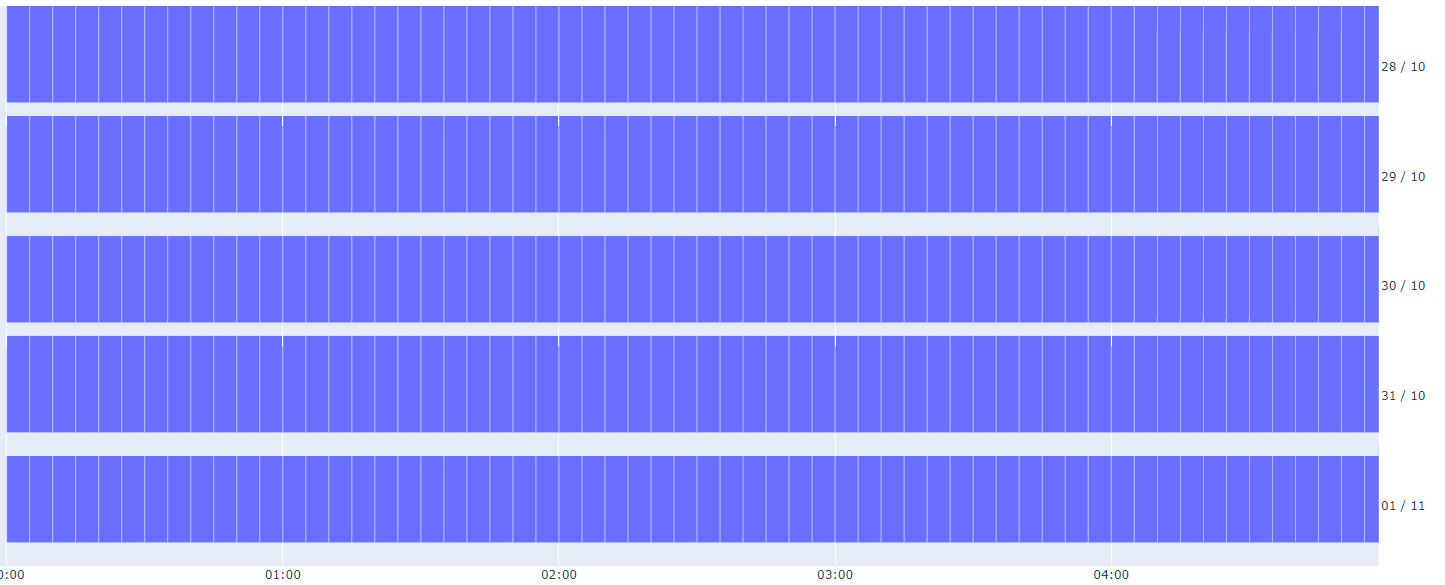
Just set the data[bar index].marker.line.width = 0
and for multiple timeline charts like the one I have… loop through each one like :-
for i in fig.data:
if isinstance(i,go._bar.Bar):
i.marker.line.width = 0
Figured it out ,
Just set the data[bar index].marker.line.width = 0
and for multiple timeline charts like the one I have… loop through each one like :-
for i in fig.data:
if isinstance(i,go._bar.Bar):
i.marker.line.width = 0