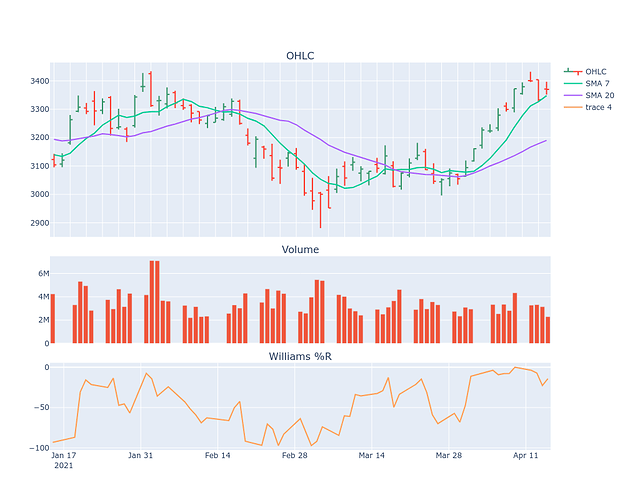
Below is the code I’m using (Python3):
import plotly.graph_objects as go
import pandas_ta as ta
from datetime import datetime, timedelta
import pandas as pd
import yfinance
from plotly.subplots import make_subplots
from plotly.offline import init_notebook_mode
from plotly.io import write_image
init_notebook_mode()
amzn = yfinance.Ticker(‘AMZN’).history(‘max’)
start = (datetime.now() - timedelta(days=90)).strftime(‘%Y-%m-%d’)
end = datetime.now().strftime(‘%Y-%m-%d’)
amzn.ta.willr(append=True)
amzn.ta.sma(length=7, append=True)
amzn.ta.sma(length=20, append=True)
fig = make_subplots(rows=3, cols=1,
shared_xaxes=True,
vertical_spacing=0.05,
subplot_titles=(‘OHLC’, ‘Volume’,“Williams %R”),
row_heights = [1000,500,500],
)
fig.add_trace(go.Ohlc(x=amzn.loc[start:end].index,
open=amzn.loc[start:end][‘open’],
high=amzn.loc[start:end][‘high’],
low=amzn.loc[start:end][‘low’],
close=amzn.loc[start:end][‘close’],
name=‘OHLC’),
row=1,col=1)
fig.add_trace(go.Bar(x=amzn.loc[start:end].index,
y=amzn.loc[start:end][‘volume’],
showlegend=False),
row=2, col=1)
sma7 = go.Scatter(x=amzn.loc[start:end].index,
y=amzn.loc[start:end][‘SMA_7’],
mode=‘lines’,
name=‘SMA 7’)
fig.add_trace(sma7, row=1, col=1)
sma20 = go.Scatter(x=amzn.loc[start:end].index,
y=amzn.loc[start:end][‘SMA_20’],
mode=‘lines’,
name=‘SMA 20’)
fig.add_trace(sma20, row=1, col=1)
fig.add_trace(go.Scatter(x=amzn.loc[start:end].index,
y=amzn.loc[start:end][‘WILLR_14’],
showlegend=True),
row=3,
col=1)
fig.update_layout(xaxis={‘type’: ‘category’},xaxis_rangeslider_visible=False, width=1000, height=800)
write_image(fig, “/home/rob/tmp/chart.png”,format=‘png’)
fig.show()
