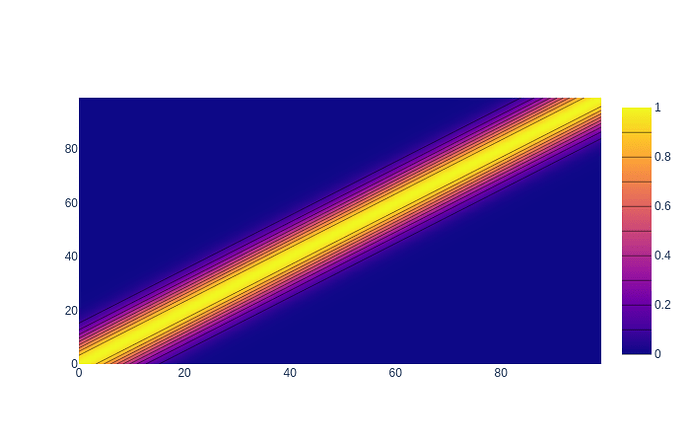
I have this matrix for which I want to create a contour plot:
M = [[np.exp(-(i-j)**2/100) for i in range(100)] for j in range(100)]
I know how to create the contour plot:
fig = go.Figure()
fig.add_contour(z=M, contours_coloring='heatmap', contours_showlines=False)
fig.show()
But, how can I remove the contour lines? contours_showlines=False does not appear to work.
