kenovs
July 31, 2021, 12:14am
1
Hi,
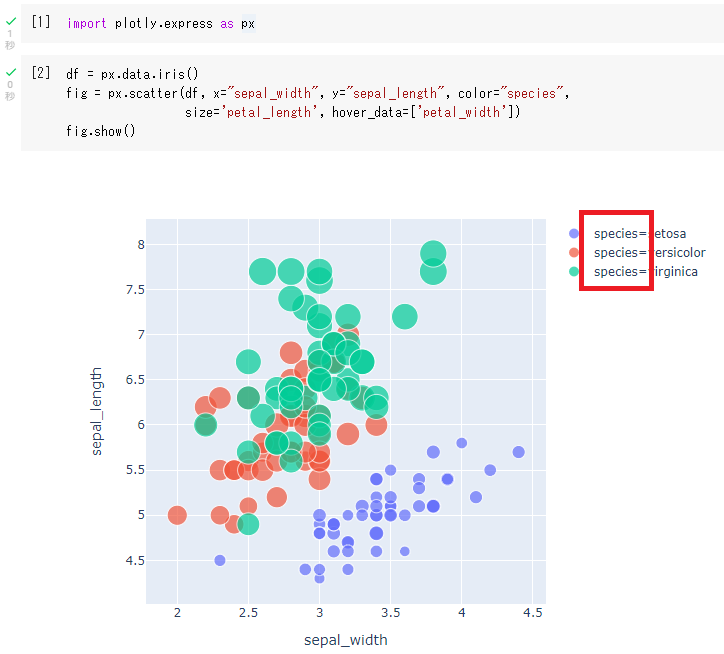
I was trying the code in the tutorial below, but couldn’t reproduce the legend to be written like it.Scatter Plots | Python | Plotly
The legend I have managed to make was in the format of “species=xxx”, but in the tutorial, it is written in much better looking format.
How can I make the legend like the tutorial?
I was running the code in google colab, so I think anyone can run in to this problem…
Thanks!
Hi @kenovs and welcome to the community!
Seems like google colab is using an older package version of plotly. With the newer versions this has been changed. Just update the package on colab with pip install plotly --upgrade and that should do it.
kenovs
July 31, 2021, 7:11am
3
Hi @atharvakatre , thank you for the reply!
Upgrading the version of plotly solved the problem!
I wonder why I hadn’t tried that…
Thank you so much for your quick response.
1 Like